Day 2 of Dashboard Week for DS32 was all about Mockaroo and Power BI:
Mockaroo
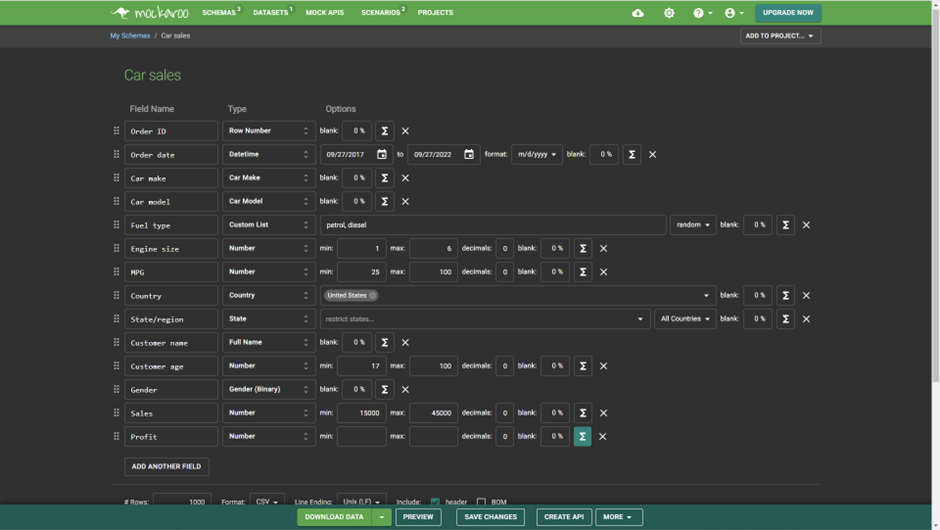
I chose to focus on the car industry in the US for today's project. The first thing I did was to create my own data set in Mockaroo. In line with the project requirements I chose to use Order date to make sure that my dataset used time series data. I chose to use Car make, Car model and Fuel type for the 3 dimensions; and Sales, Profit, Engine size and MPG for the 4 measures. I also included demographic data on customers including Customer name, Customer age and Gender. Each row of my data was an individual car sale. My schema in Mockaroo ended up looking like this:
Excalidraw
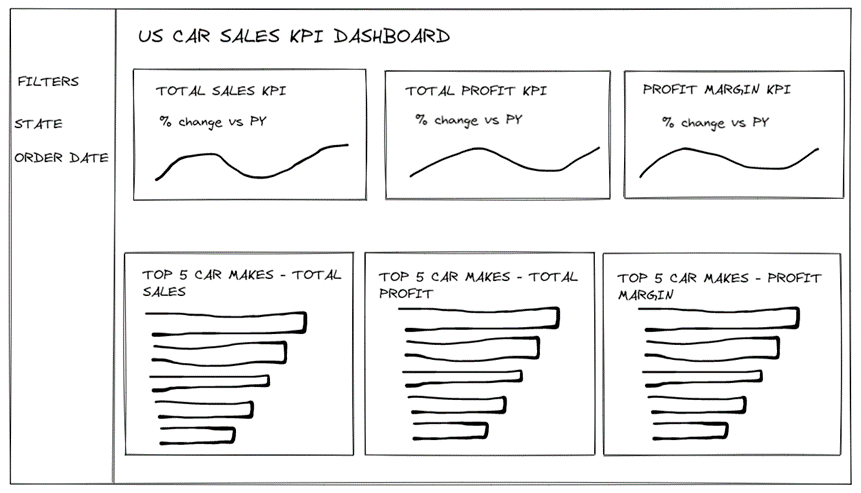
Before creating the dashboard in Power Bi we had to sketch out our design using Excalidraw. I did some research into KPI dashboards to get an idea of design. I chose to use 3 KPIs: total sales, total profit and profit margin, including the % change for the current year vs the previous year. I then chose to use 3 simple bar charts showing the top 5 car makes in terms of total sales, total profit and profit margin. My final sketch looked like this:
Power Bi
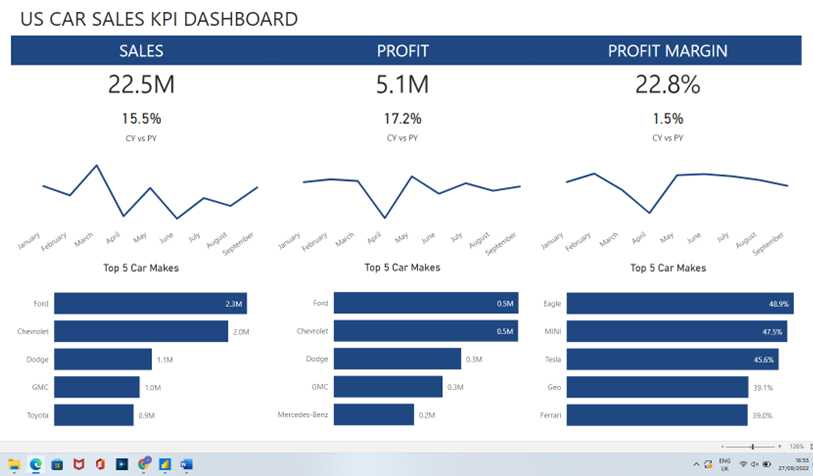
Having only used Power BI once before, I took some time to refamiliarise myself with how it worked. This didn't take long though as it's quite an intuitive software to use. My final dashboard looked very similar to my original sketch.
Link to dashboard: Car Sales Power Bi Dashboard - Power BI