


The task
Use the Breaking Bad API to obtain data for characters, episodes, quotes, and deaths from every episode of Breaking Bad and Better Call Saul.
Alteryx Workflow

Step 1 - Text Input Tool
I began by putting a Text Input onto the Canvas for the Characters endpoint. I inserted the base URL into the cell and changed the header to 'URL'.
Step 2 - Download Tool
I added a Download tool after the Text Input tool to bring back data from a location on the internet into Alteryx. 'URL' will appear in the dropdown menu.
Step 3 - JSON Parse Tool
The API call brought back JSON data so the next step was to connect a JSON Parse tool to the Download tool. The only configuration I needed to do was to select 'DownloadData' from the dropdown menu. This created 2 new fields: JSON_Name and JSON_ValueString.
At this point, I repeated the process with the Download tool and the JSON Parse tool with the 3 other URLs for the Episodes, Quotes and Deaths endpoint.
Step 4 - Data Cleansing
- Text to Columns - 2 columns with a . delimiter
- Select - renamed JSON_Name as Header
- Crosstab - used Header as Column Headers and JSON_ValueString as Values and selected Concatenate
Additional steps for Characters API:
- Transpose - had to transpose the 'appearance' and 'occupation' fields to prevent my dataset from spreading out (an array)
- Filter tool - connected to each Transpose tool to filter out the empty fields
- Union tool - unioned the filtered data together
- Unique tool - the only configuration I had to do here was select 'CharacterID' to obtain the unique rows of data
Step 5 - Output Tool
Outputted the 4 workflows as a Tableau Hyper file.
Excalidraw
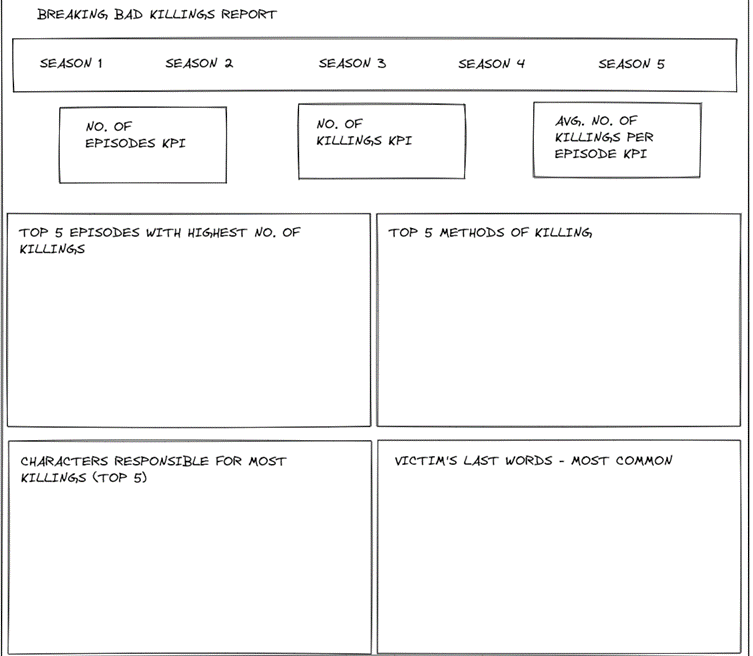
The next step I took was to sketch my dashboard design in Excalidraw:
Final Dashboard
My final dashboard ended up looking like this:
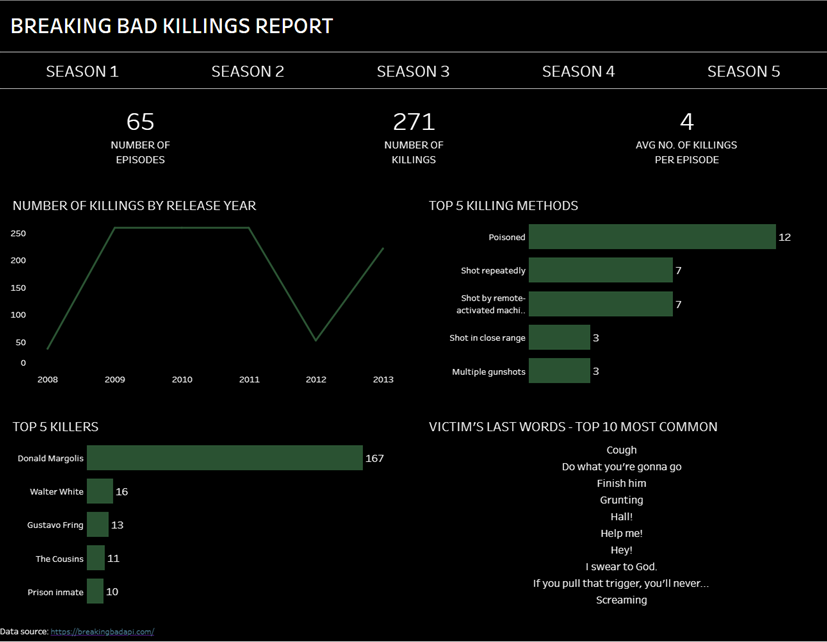
Link to dashboard: https://public.tableau.com/app/profile/imogen8656/viz/BreakingBadAPIDashboard/Dashboard1