Today is DS14’s first day of the Data School’s famous Dashboard Week!
For our first challenge, we had to scrape UFO sightings data from The National UFO Reporting Center Database website using Alteryx and then create a viz in Tableau. Andy posted the full details for our task here.
1. Alteryx Workflow
Luckily, the data was organised in a neat html table and with the help of the download tool and a lot of RegEx, we could parse the different elements nicely.
Here’s my workflow:
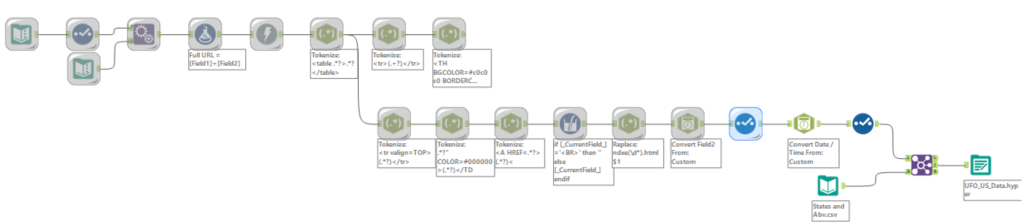
(Being conscious that all of us are using this URL excessively, I made sure to cache my tools.)
After obtaining the full data and extracting it in a .hyper format for Tableau, I had to pause and do a one-hour webinar session. Although I felt like I was in a good place at that point, I did bear in mind I had one hour less than my fellow cohortians to work on my dashboard.
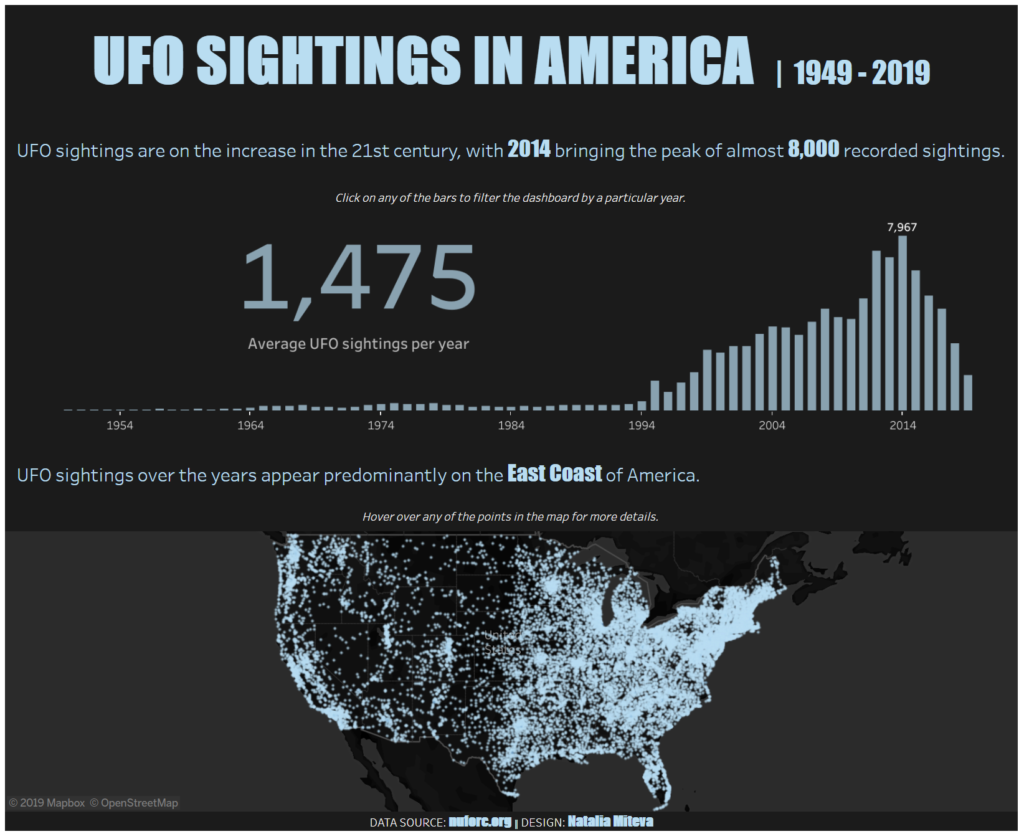
2. Tableau Dashboard
I decided to keep it simple and focus on one country – America. I went for a big number displaying the average UFO sightings per year, a bar chart with number of sightings per year (filtered to 1949 to 2019), and a map showing number of sightings per city.
Also, I included a couple of text boxes with some quick insights that stood out to me whilst working with the data.
Here’s the link to my final product, and the screenshot below:
All in all, day one of Dashboard Week was very intense but also super fun! Looking forward to seeing what’s in store for the following days.