Day 3 of dashboard week was stellar! We were exploring data about the Solar System. Here‘s the full brief for the task.
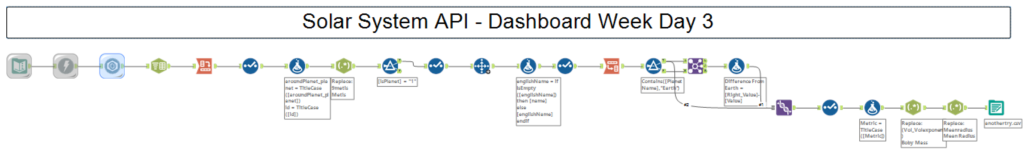
Using the Solar System OpenData API, we downloaded the data via Alteryx. Since we had a nicely structured JSON file, it was easier than yesterday to parse the data with webscraping. After using the first 5 tools in the below workflow, I had the full details for all planets, stars and moons. I decided to focus on just the main 8 planets, so I did some further clean-up and restructuring of the data.
Here’s my full workflow:
Now I was ready to start building a dashboard. But here’s the twist! TABLEAU WAS FORBIDDEN.
Instead, we had to learn how to use Power BI and create our vizzes there. It was definitely a challenge to stop myself from thinking about how I would normally visualise the data in Tableau, and get on with learning the new software.
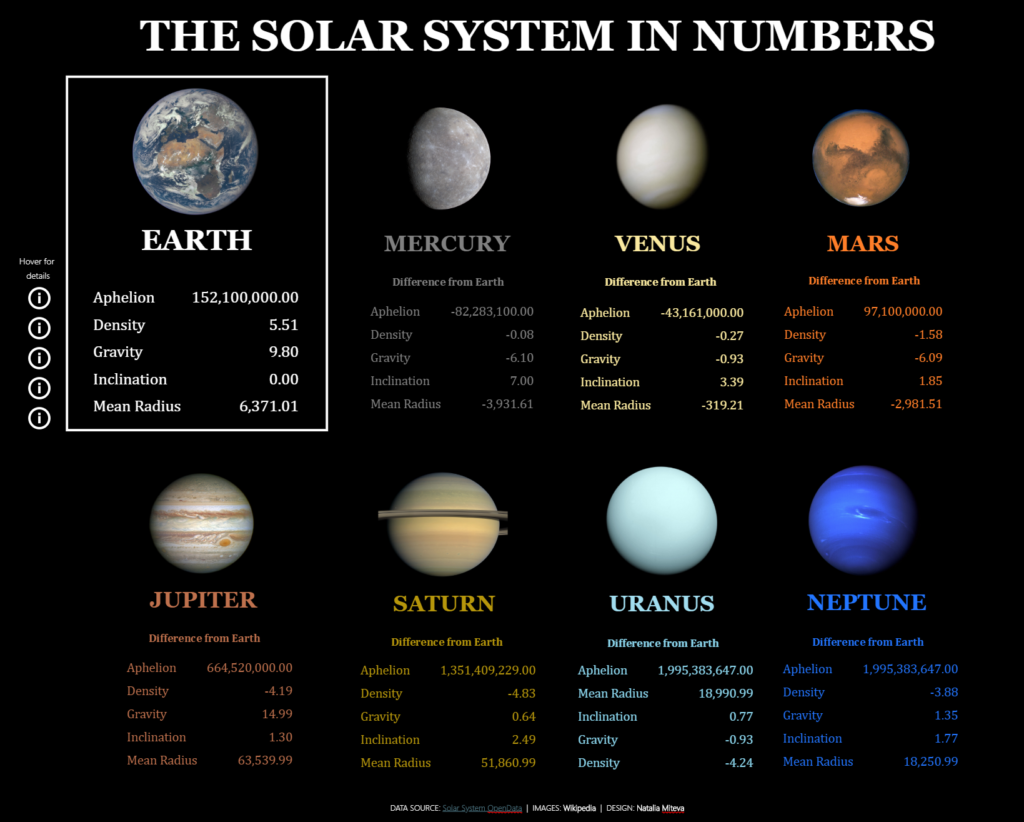
After watching some introductory videos and experimenting with some chart types, I decided to keep it simple and created an infographic-style viz.
Here’s the link to my final product and a screenshot below: