Cannot believe it is day 4 of our dashboard week! Today, we were working with survey data about people’s favourite candies. Here‘s the full brief for the task.
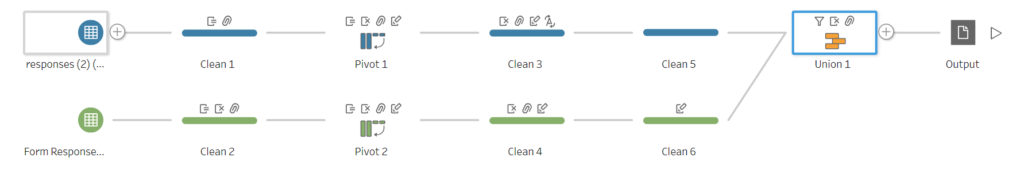
We had to use Tableau Prep Builder instead of Alteryx to clean up our data. It was in a relatively good format and it needed mostly just pivoting and unioning the files from the different years together, as you would see in my workflow below.
As per usual, Andy added a twist, allowing us to use only Web Edit and NOT Tableau Desktop to create our dashboards. This meant we had to work only on the Tableau Server, and we quickly discovered that it had some differences and limitations. For example, you cannot add filters to context, cannot format the tooltips, nor remove them, and some of the formatting options available in the Desktop version are non-existent on the Server.
Nevertheless, I am quite happy with my final product from today. Here’s the link to my viz and a screenshot below:
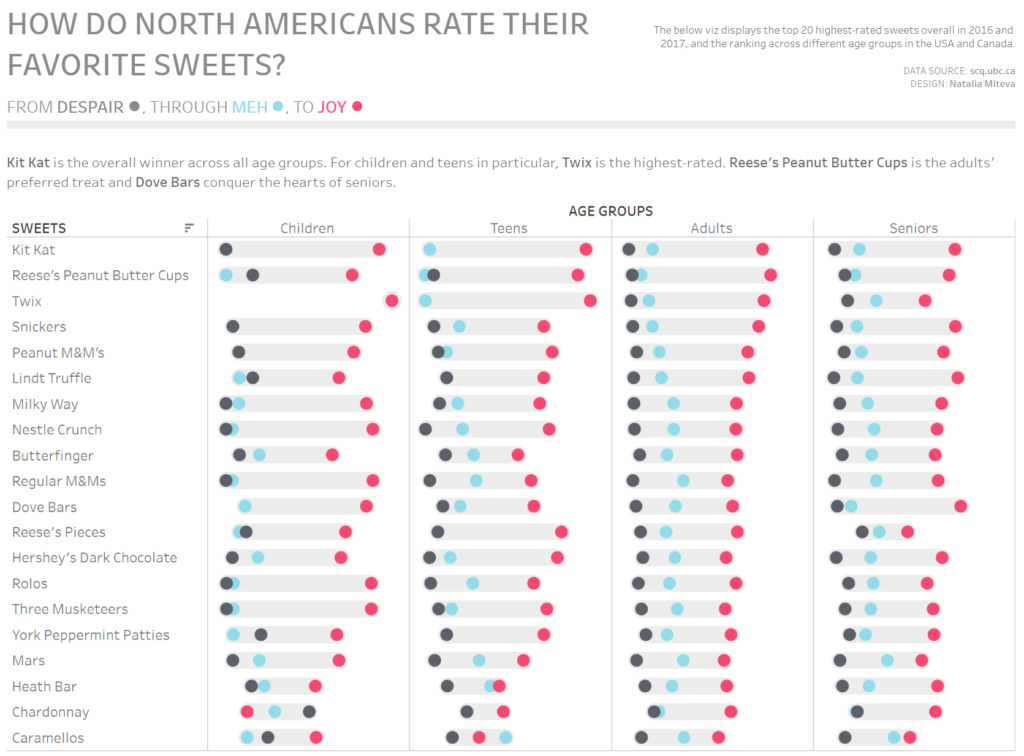
P.S. I have spelled ‘FAVORITE’ wrong on purpose 😉