


When building dashboards in Tableau, it’s easy to focus on the charts and forget about the overall design.
But small changes to things like colour, spacing, and layout can make a huge difference to how a dashboard feels.
To show this, I took a basic sales dashboard and made a few simple design improvements.
Before and After
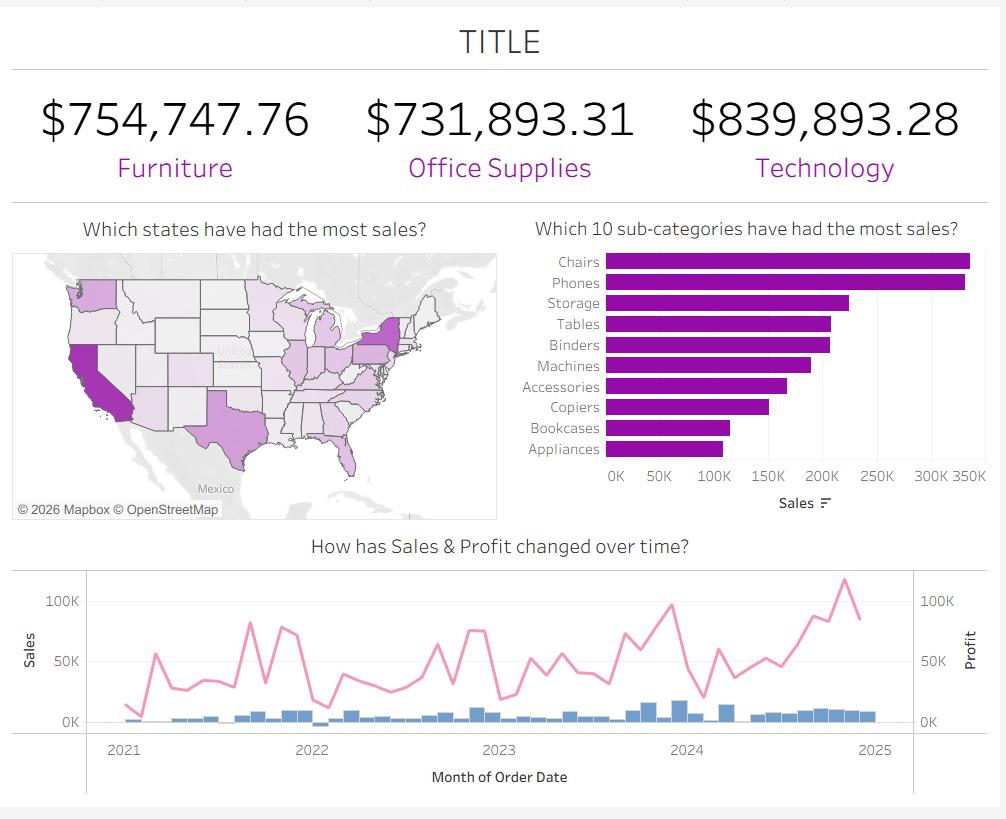
Before
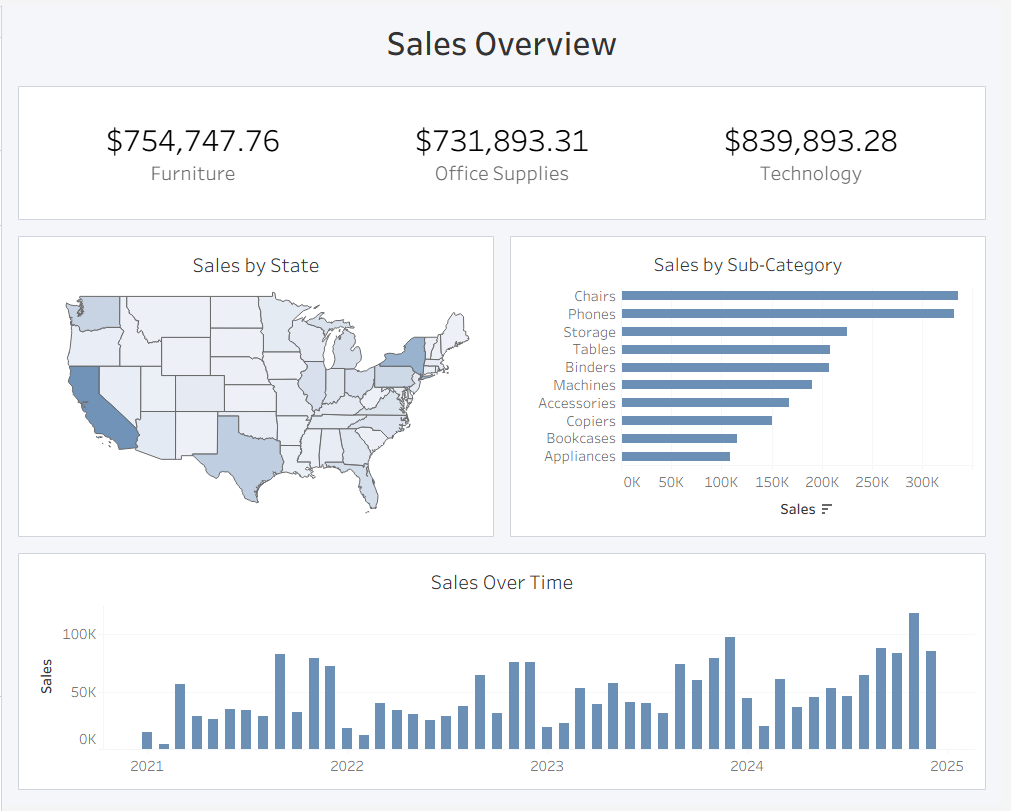
After
What Changed?
I didn’t rebuild anything from scratch. I focused on three things:
- Colour
- Padding
- White space
Colour: Less Intensity, Improved Readability
The original dashboard used a bright purple, which felt quite intense and drew too much attention away from the data.
In the updated version, I switched to a more muted blue and used it consistently across all charts.
This does a few things:
- Makes the dashboard easier to look at, and is more gentle on the viewer's eyes.
- Reduces visual noise
- Creates consistency across views
I also kept most of the background neutral, so the data stands out rather than the styling.
Padding: Giving Everything Room to Breathe
One of the biggest differences is spacing.
In the original version, everything feels quite tight:
- Charts are close to each other
- Titles sit very close to the edges
- There’s little separation between sections
In the updated version, I added padding inside containers and around elements, and introduced subtle borders around the charts.
This helps to:
- Clearly separate sections
- Improve readability
- Make the layout feel more structured
Padding might seem like a small change, but it makes a big visual difference.
White Space: Not Everything Needs to Be Filled
It’s tempting to use every available pixel in a dashboard, especially when you’re starting out, but white space is what makes a dashboard feel clean and easy to scan.
In the improved version:
- There is more space between sections
- Elements are grouped more clearly
- The layout feels less crowded
White space should not be seen by the dashboard designer as wasted space. It helps guide the user’s eye and makes the dashboard easier to understand.
Simplifying the Chart: Clarity Over Complexity
In the original dashboard, the chart at the bottom showed both sales and profit over time in a line and bar chart.
While this adds more information, it also makes the chart harder to read, especially for a beginner audience. It was also slightly confusing, as this is a sales focused dashboard, and profit was only introduced in this one chart.
In the updated version, I simplified this to a bar chart showing just sales over time. I also reduced the width of the bars, to reduce visual clutter and give the chart a more professional look.
This makes it:
- Easier to understand at a glance
- More consistent with the rest of the dashboard
- Better aligned with the main focus on sales
Sometimes, showing less actually makes a dashboard more effective.
Why This Matters
What’s important here is that the improvement didn’t come from changing the data or adding more complexity. Instead, it came from simplifying and refining the design.
Small changes like using a more muted colour, adding spacing, and focusing each chart on a clear purpose can make a big difference to how a dashboard is understood. Good design is about making things clearer.
You don’t need advanced techniques to improve your dashboards, just a few thoughtful design choices.