


After building my Formula 1 chatbot with Snowflake Cortex Agents, I wanted to take the project a step further. While the chatbot could already answer questions about Formula 1 history using natural language, I wanted to connect it directly to a Tableau dashboard and have the dashboard respond to the conversation.
The goal was simple: rather than manually selecting filters and getting lost in charts, a user could ask a question in plain English and have the dashboard automatically update to show the relevant data.
Building the Dashboard
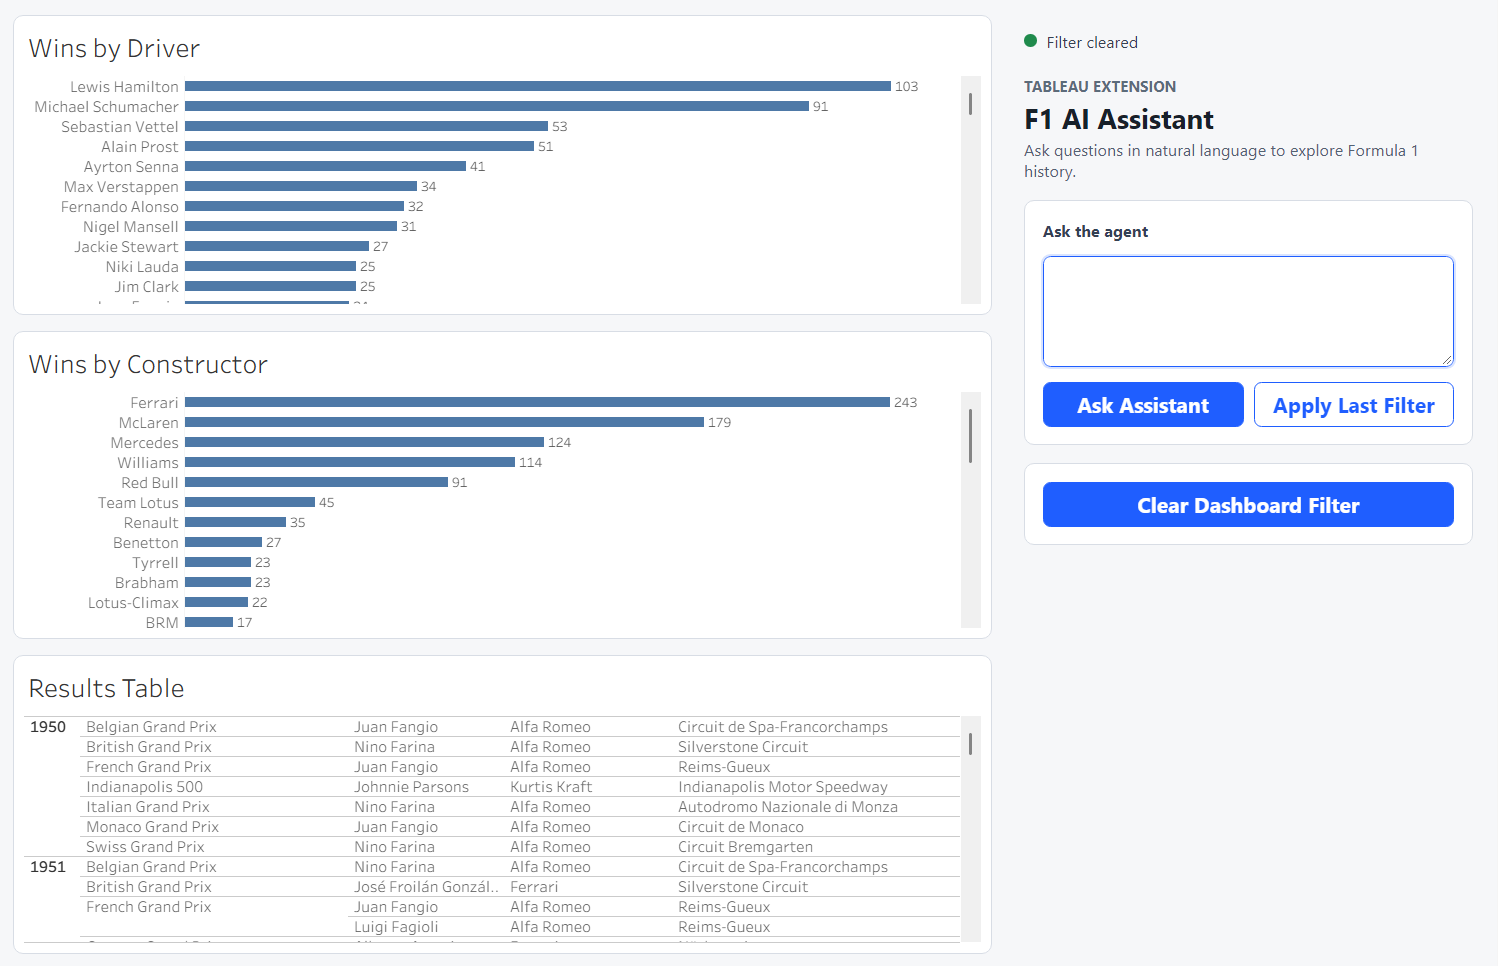
To keep the project focused on the integration rather than dashboard design, I created a very simple Tableau dashboard containing three views:
- Driver wins
- Constructor wins
- Race results
The dashboard was connected live to the same Formula 1 data source on Snowflake that was used by the Cortex Agent. This meant both the dashboard and the agent were working from the same underlying data source. The next step was to get the agent and Tableau to communicate with each other.
Tableau Extensions
The solution came from the Tableau Extensions API, which allows developers to embed custom web applications directly inside a Tableau dashboard.
I created a small Tableau Extension using JavaScript and the Tableau Extensions API that acted as the bridge between Tableau and the Cortex Agent. It has a UI that users can use to ask questions in natural language, just as they would when using the standalone chatbot.
The assistant sends the question to the Cortex Agent, receives a response, and then updates the dashboard to display the relevant information. Instead of navigating the dashboard through filters alone, users can describe what they want to know in plain English.
Turning Chatbot Responses into Dashboard Filters
For the integration to work, the information used by the agent to answer a question also needed to be passed to Tableau. This would allow the dashboard to be filtered using the same criteria that the agent used when generating its response.
For example, when asked:
Which drivers have won the most races for Ferrari? Show me the top five.
the agent identifies the relevant drivers and constructor in order to answer the question. That same information is then passed to the Tableau Extension, which applies the appropriate filters to the dashboard.
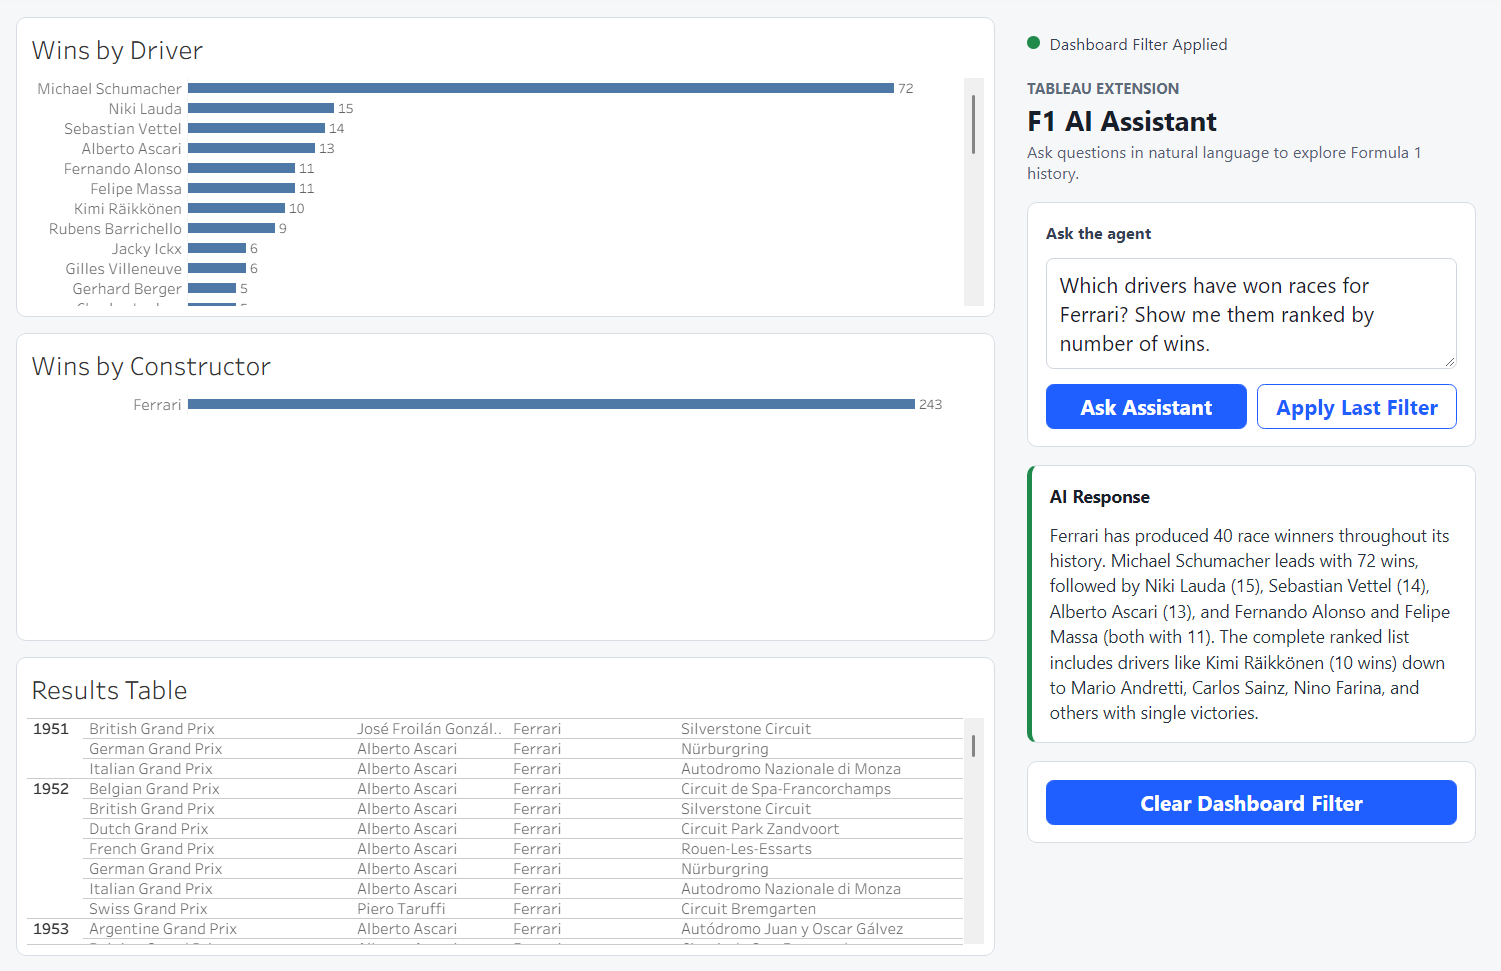
As a result, the written response and the visualisations remain aligned. Rather than simply displaying an answer, the dashboard updates to reflect the same context used by the agent when generating it.
Keeping Credentials Secure
Because the Tableau Extension runs inside a web browser, I did not want to expose Snowflake credentials directly in the client-side code.
To solve this, I created a small Python proxy application that sits between the Tableau Extension and Snowflake. The extension sends requests to the proxy, which then communicates with the Cortex Agent on behalf of the user. This keeps authentication details separate from the browser while allowing the extension to interact with Snowflake securely.
The Final Result
The finished dashboard allows users to ask questions about Formula 1 history and immediately see the relevant data highlighted in the dashboard. The assistant handles the querying and filtering, while Tableau provides the visual context behind the answer.
This project was a great introduction to the Tableau Extensions API and demonstrated how AI tools can be combined with traditional dashboards. Rather than replacing visualisations, the Cortex Agent acts as another way for users to interact with them, helping them find and explore the information they need more quickly.