
Want to know more about Tableau Prep?
Here are a few basic things I learned: Tableau Prep 101: Prep vs Alteryx Tools + What it can/can’t do
Let’s say you manage a hospital. How many patients are under care as of today?
Let’s say you have a dataset on hospital management.
Your dataset might show:
- The day the hospital admitted patient X
- The day the hospital discharged patient X.
But how can you calculate the number of patients who are under care on a specific date?
Let’s try to work on it in Tableau.
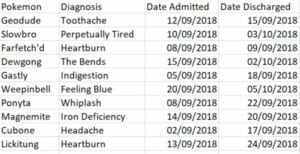
Pokemon at the hospital. From when to when?
Emily always finds catchy examples to use and created an ad hoc Pokemon folder with datasets to practice on using Tableau Prep.
“Pokemon at the hospital” was the one.
Dewgong had the bends. Gastly was suffering from indigestion. Cubone had a headache. And Slowbro was feeling perpetually tired.
Pokemon is not really my thing, so I learned something new.
For each one of them, the dataset showed:
- The day the hospital had admitted them and
- The day it had discharged them.
Moving to Tableau: Is our data structure compatible with what we want to do?
In the morning, I had to leave for two hours.
The others started working on their project. In the meantime, Emily brought me up to speed by exploring the Pokemon’s health issues.
Her first question was:
How can you visualize the data to show the difference between the two dates, admission and discharge?
One solution: Gantt Bar
Which calculation? We added a new calculation using DATEDIFF:
DATEDIFF(“day”, [Date Admitted], [Date Discharged])
A look at DATEDIFF
DATEDIFF (date_part, start_date, end_date, [start_of_week])
DATEDIFF returns the difference between two dates where start_date is subtracted from end_date. The difference is expressed in units of date_part. If start_of_week is omitted, the week start day is determined by the start day configured for the data source.
Example: DATEDIFF (‘month’, #2004-04-15#, #2004-07-03#, ‘Sunday’) = 3 (months)
After this step, we dragged:
- Date Admitted (as Day, Continuous) onto Columns
- Pokemon onto Rows
- SUM(DATEDIFF formula) onto the Size shelf.
And we got a basic Gantt chart.
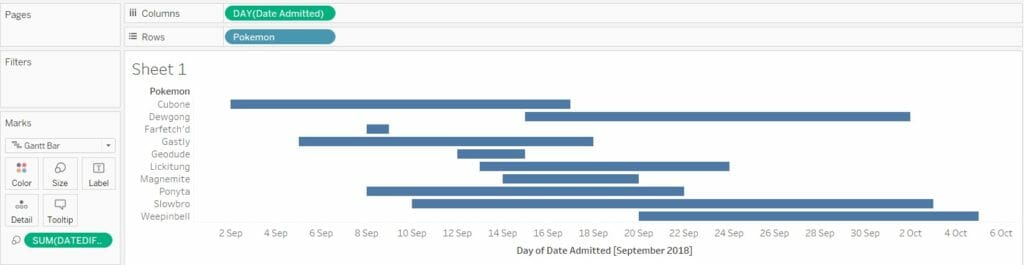
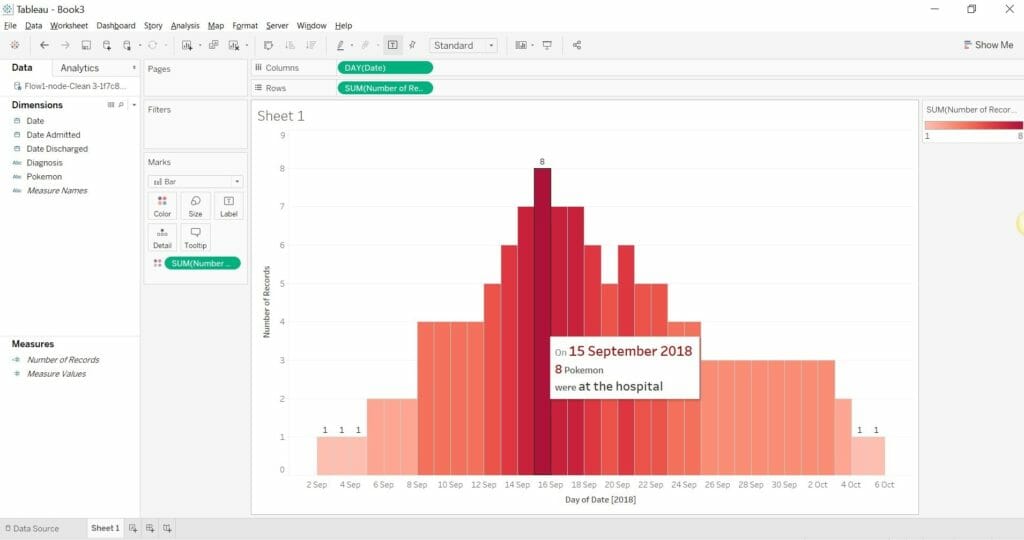
By looking at it, there seems to be more overlap at the hospital around September 15–16.
However, to answer our question we need to get back to Tableau Prep.
Back to Tableau Prep: Data scaffolding to get the date field right
But what is Data Scaffolding?
Alexander Mou describes it here as “a technique to artificially create a data structure for the purpose of visualization. It will either reshape the original data or blend multiple data sources in such a way for better visualization”.
Here’s a video by Tableau Zen Master Joe Mako.
And here’s an article by Phillip Lowe at The Information Lab on data scaffolding in Alteryx.
First things first: Connect to your data source
Whenever you start with Tableau Prep, you need to add your data source.
- Go to Connections on the left,
- Click on the + icon and then:
Click on the type of file you want to connect to (for example Microsoft Excel or Text file for CSV files).

The sheet will appear on the pane.
Then, click on the + icon next to it and Insert Step to get a better look at the table.
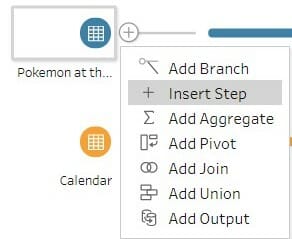
It will appear as a horizontal line, and it’s usually named Clean.
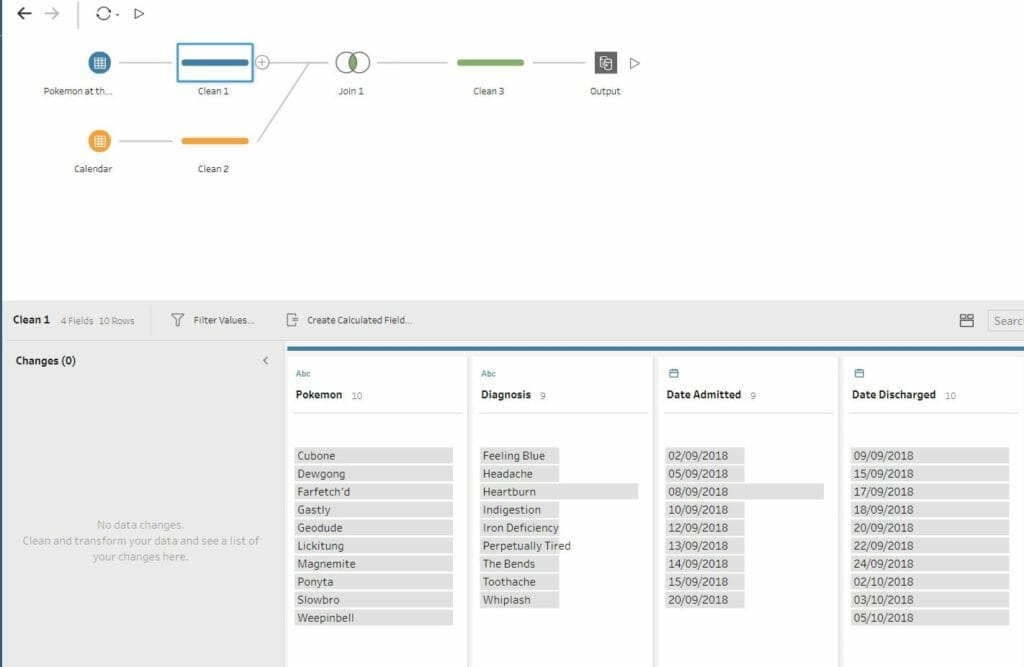
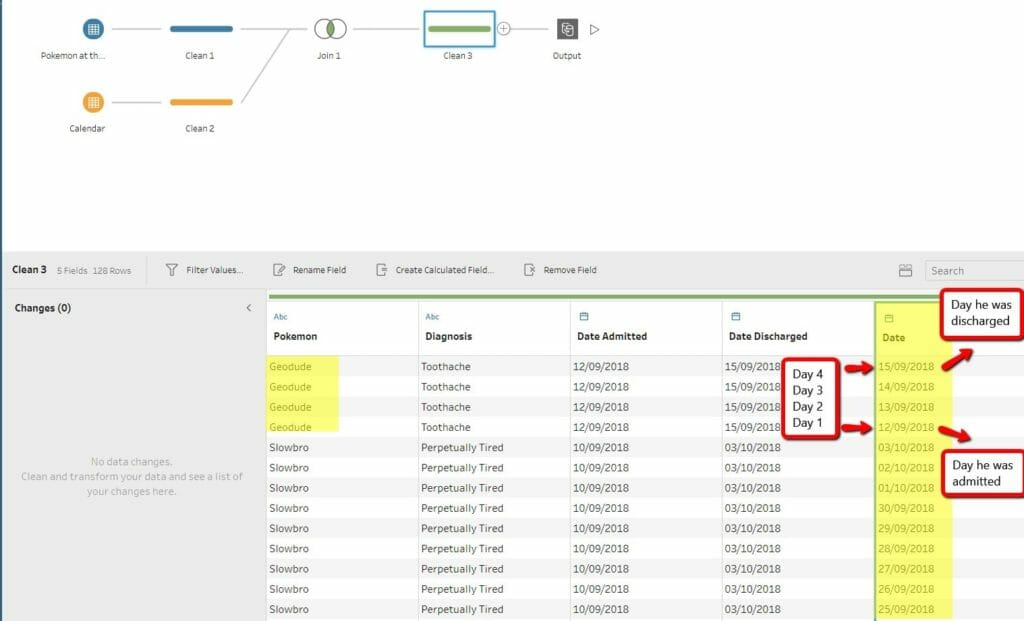
This is what my flow looks like:
Data scaffolding step by step
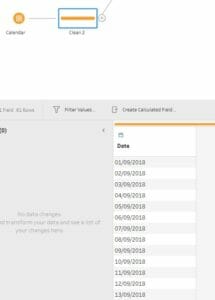
After adding the first data source, I want to join it with a second file called “Calendar”. It contains just a list of dates:
Pay attention to the Join Clauses!
What we want is a long date field containing all the dates that each Pokemon had been at the hospital:
- From the day they were admitted
- To the day they were released.
To do that, we need to join the two sheets and apply Join Clauses based on common field names.
But look at the Join Clauses. For each patient, we want a list of dates that are:
- Greater than the date of admission and
- Smaller than the date of discharge.
This way, we can build a range of dates for each Pokemon.
- Join Clause #1: Date (in the Calendar file) must be greater or equal to Date Admitted.
We want to include the day they were admitted + the days that followed . . .
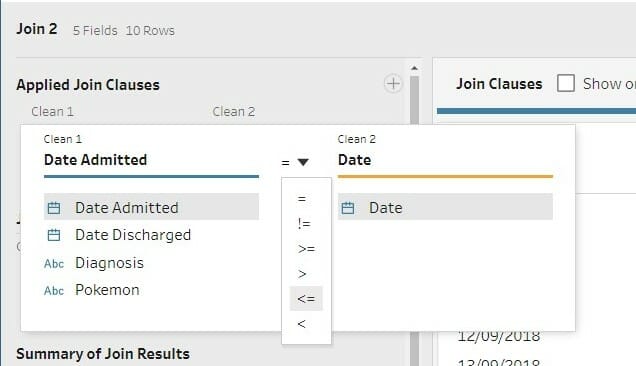
. . . until the day they were discharged.
- Join Clause #2: Date (in the Calendar file) must be smaller or equal to Date Discharged.
To add this second Join Clause, click on the + icon. The second Join Clause will look like this:
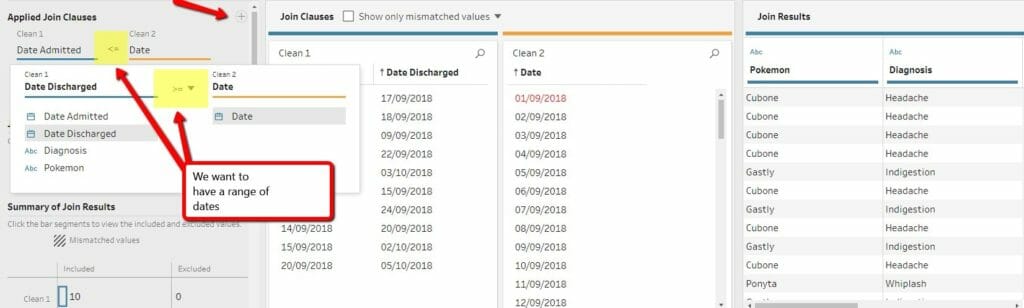
And the final join now displays the dates the way we wanted:
Output tool
It’s time to output the data and use the file on Tableau.
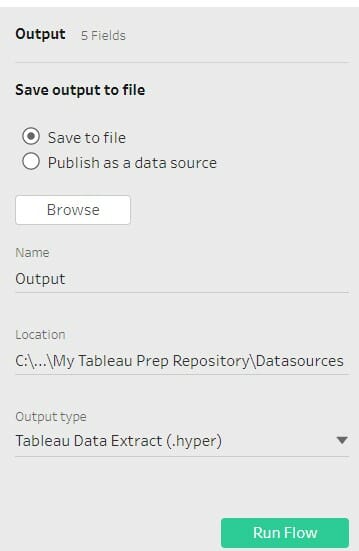
To run the flow, you can either click on the green button or on the white Arrow next to the Output icon.
Making dates work in Tableau
Drag:
- Date (as Continuous and as Day May 8, 2015) onto Columns
- SUM(Number of Records) onto Rows
A bar chart will appear. You will now be able to see how many Pokemon were at the hospital on a specific date.
A real case scenario
I’d like to apply this technique to a real case scenario and a more complex dataset.
As soon as I find the right one to clean, I will update the post!