


Spatial data can be an incredibly powerful tool when it comes to gaining insights, especially about population demographics. Huge amounts of census data is available from official government agencies which makes it easy to access.
By default Tableau has quite a limited knowledge of specific geographical boundaries. For example it can recognise countries and US states but when it is provided with UK counties for example, it begins to struggle. This is no real fault of Tableau, the way in which the UK and other countries can be divided up is vast, and each use case has its own way of doing it. Luckily census data in the UK tends to be provided in at least two levels of geography granularity.
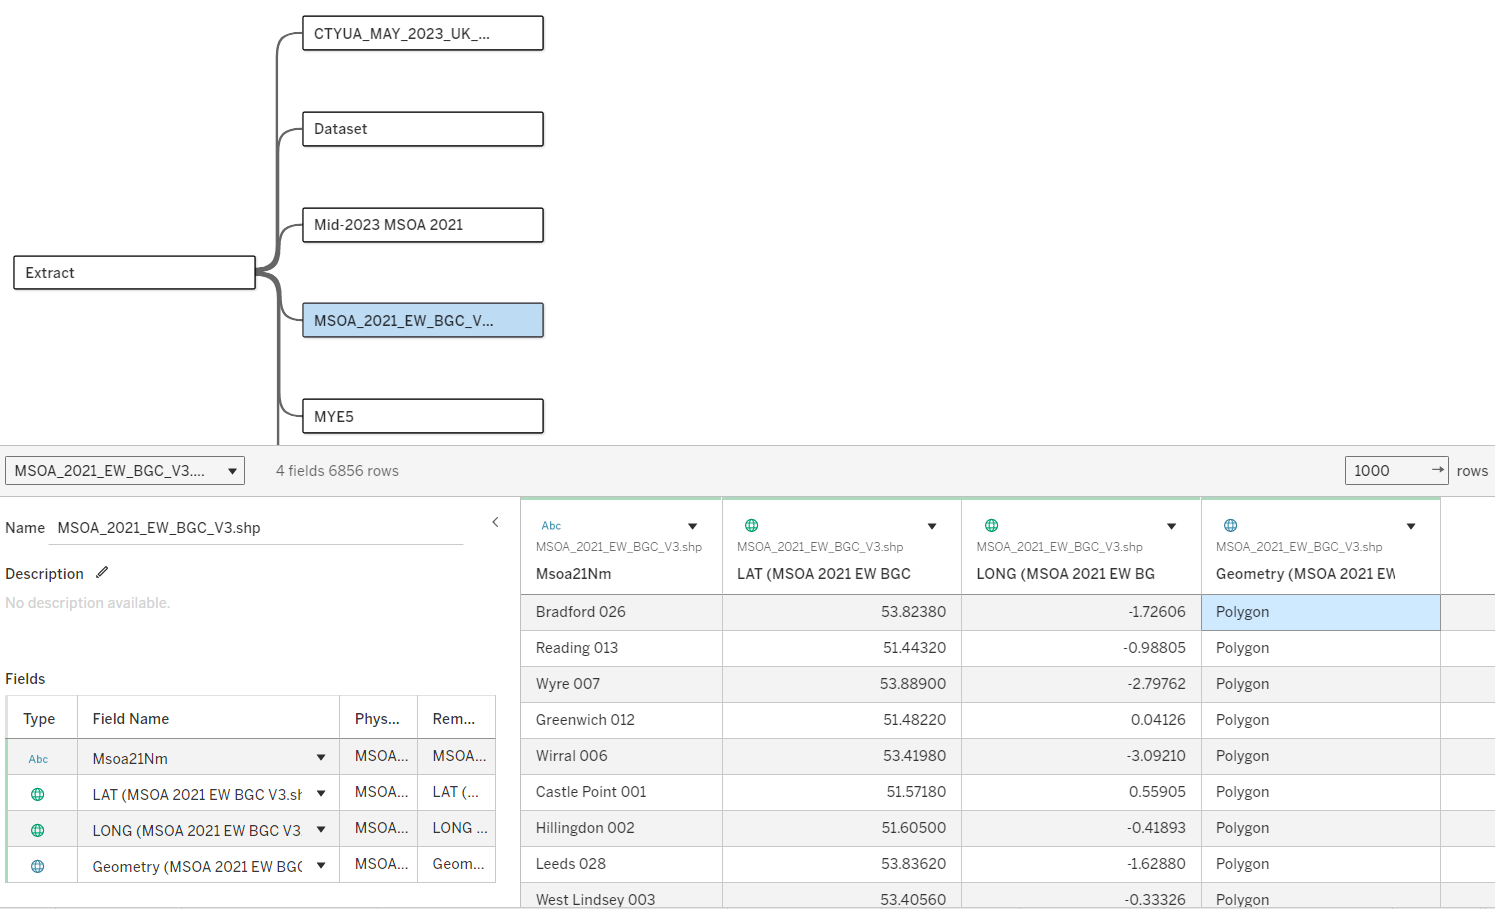
The way in which Tableau is able to draw new geographical boundaries is by drawing specific polygon shapes in specific locations on a map. These shape files must be provided for Tableau to draw them. When brought into Tableau they should look like something shown in figure 1.
MSOAs
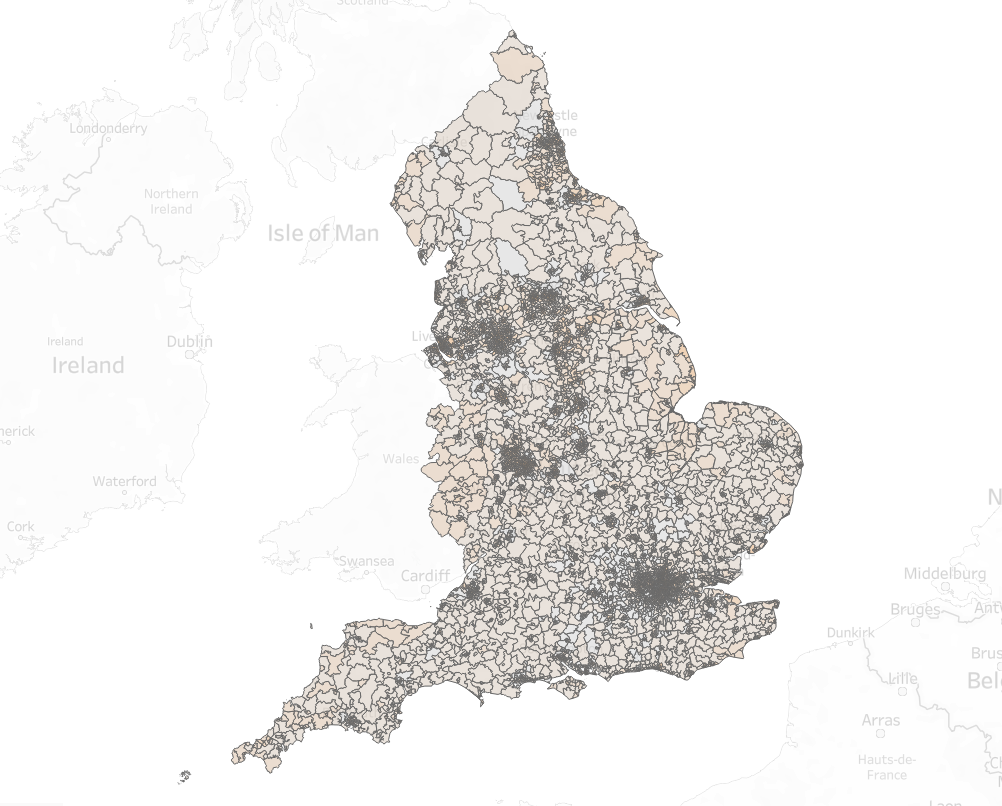
Middle Layer Super Output Areas are medium sized geographies used in England and Wales which cover between 5000 and 15000 households. They provide a good balance of granularity and data protection so are ideal for census related data. In total there are 6856 MSOAs in England and 408 in Wales. See figure 2 for a map of MSOAs.
LSOAs
Lower Level Super Output Areas divide England and Wales into even smaller parts and contain populations between 1000 and 3000 people. In total there are 33755 LSOAs in England and 1917 in Wales. LSOAs are themselves made up of Output Areas (OAs) which provides even more detail. The level of granularity required very much depends on the nature of the analysis. If you are interested in very specific areas then LSOAs (or OAs) would be ideal but if you are only concerned with regional differences then county level geographies may be sufficient.