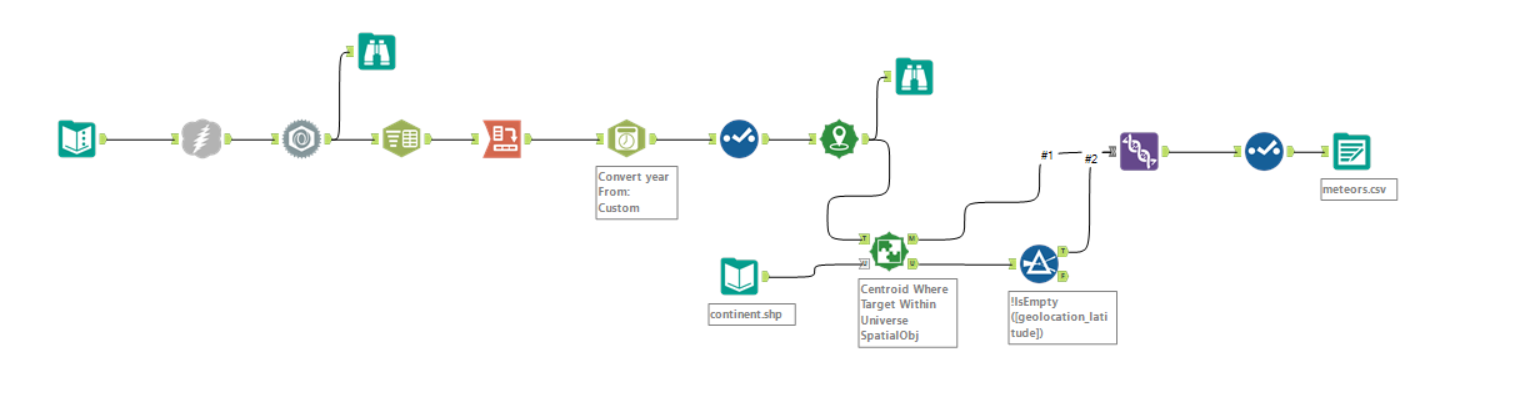
On the final day of dashboard week, we got our data from NASA. Given the shorter time constraint, the data was easy to retrieve; requiring only a short workflow as to decipher the data from the API. To get some more information, I also added in the continents from a shape file using a spatial match.
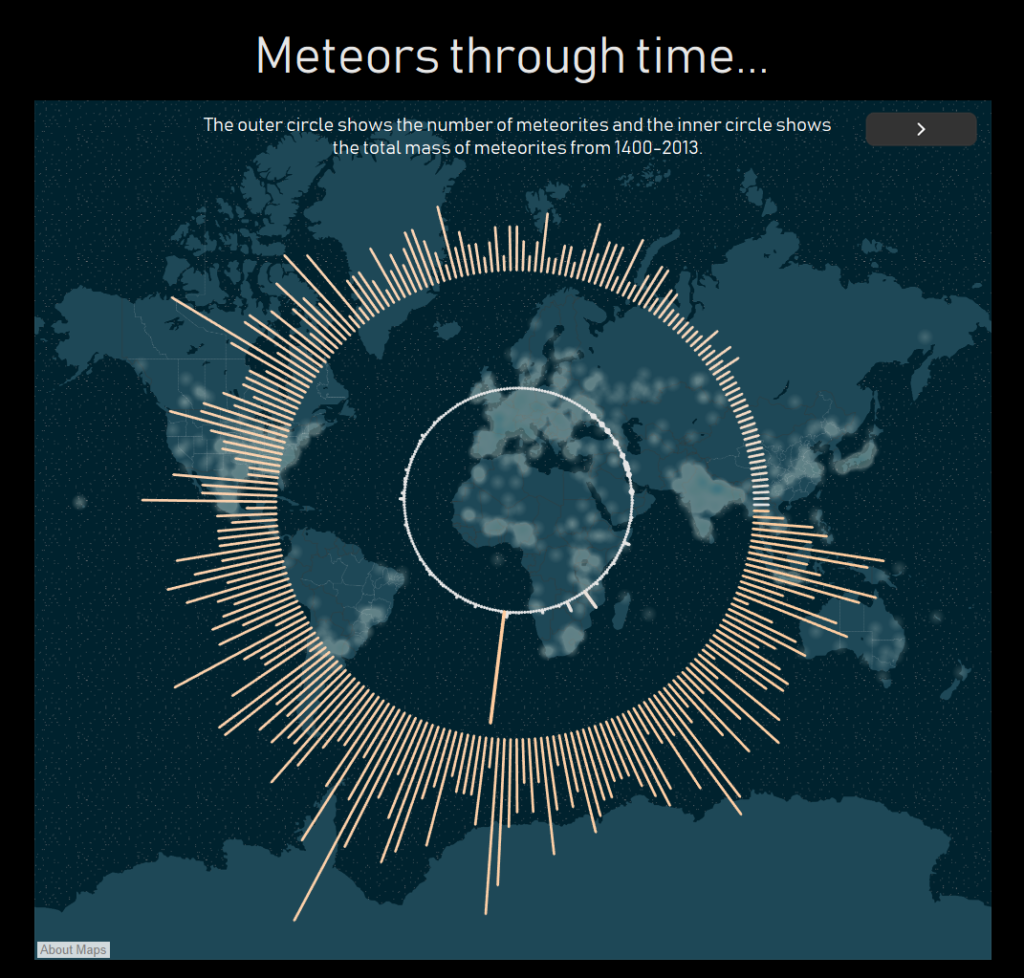
Subsequent to this, I attempted to make some radial bar charts as I felt it was a good opportunity to learn something new. After a few calculations (which I will document in a future blog), I came up with this:
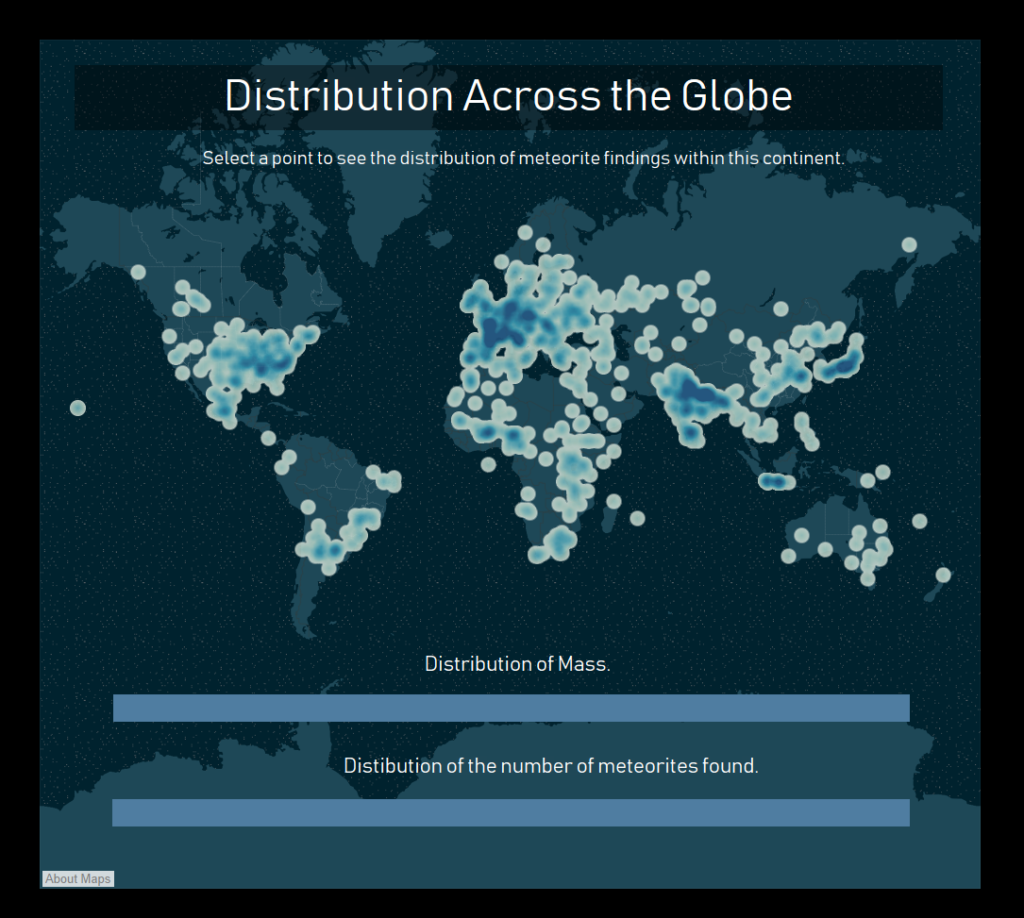
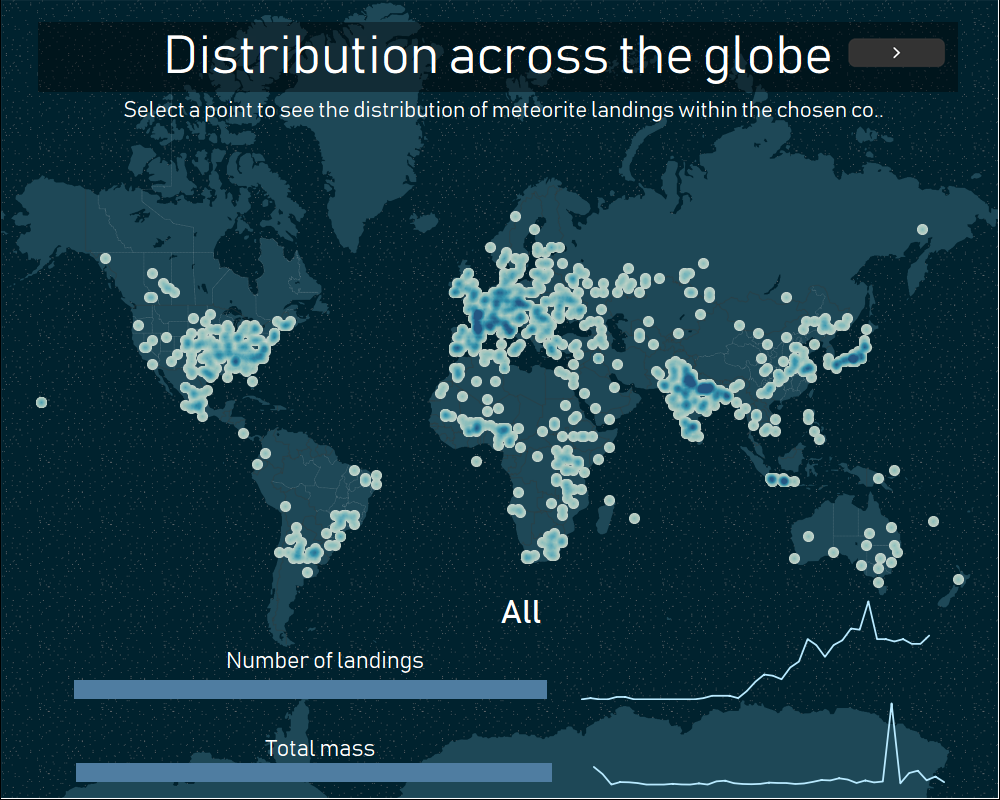
Another part of the challenge was to employ the use of set actions. This occurred on my second dashboard. If you select a point on the map, the bar chart will illustrate the % of total concerning mass and number of meteors found within the continent that particular meteorite was found, compared to the rest of the continents. Given this was the first time we used set actions, they were a little tricky to configure, but I look forward to discovering their utility further.
Updated:
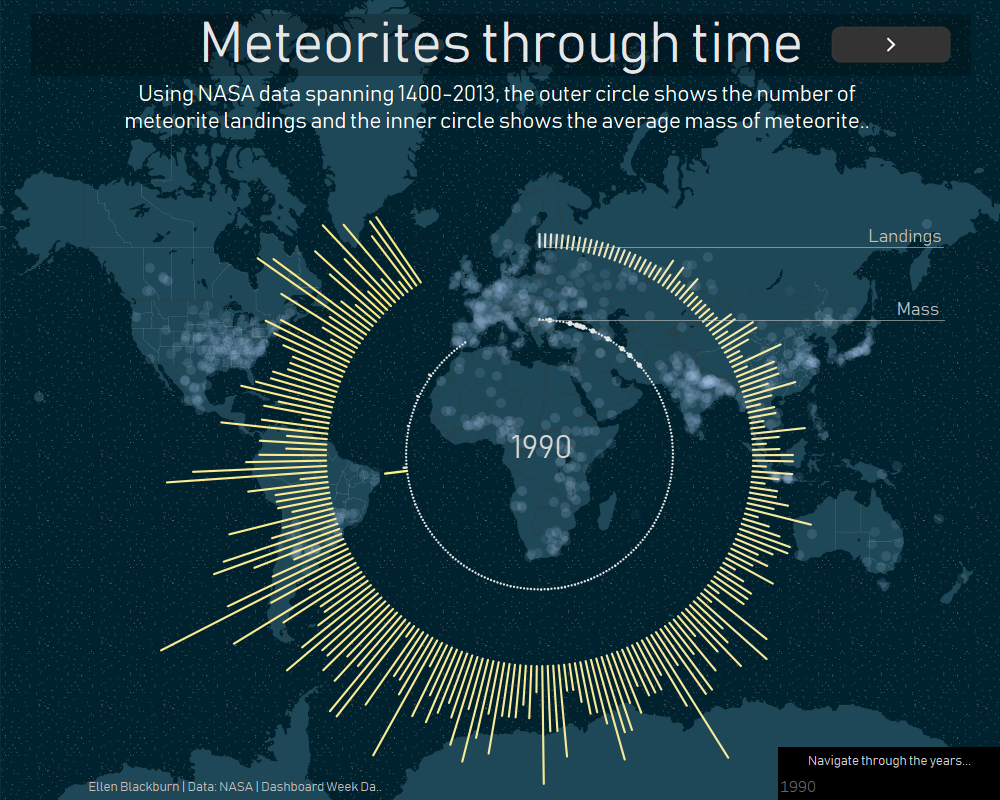
After our presentation on Friday, I implemented the feedback I received, and this is the finished result:
Whilst it looks good when year is on the pages shelf, the “play” button isn’t supported by Tableau public. Accordingly, I think it may be best as a date filter.
`See my viz here.