When you have a chart that is looking very cluttered and becoming hard to read, then you may start thinking about filtering out some of the data to be able to delve deeper into the key insights.
In this blog, I will use the Superstore sample data on Tableau Desktop to show you the four different filtering options you can do to a dimension field.
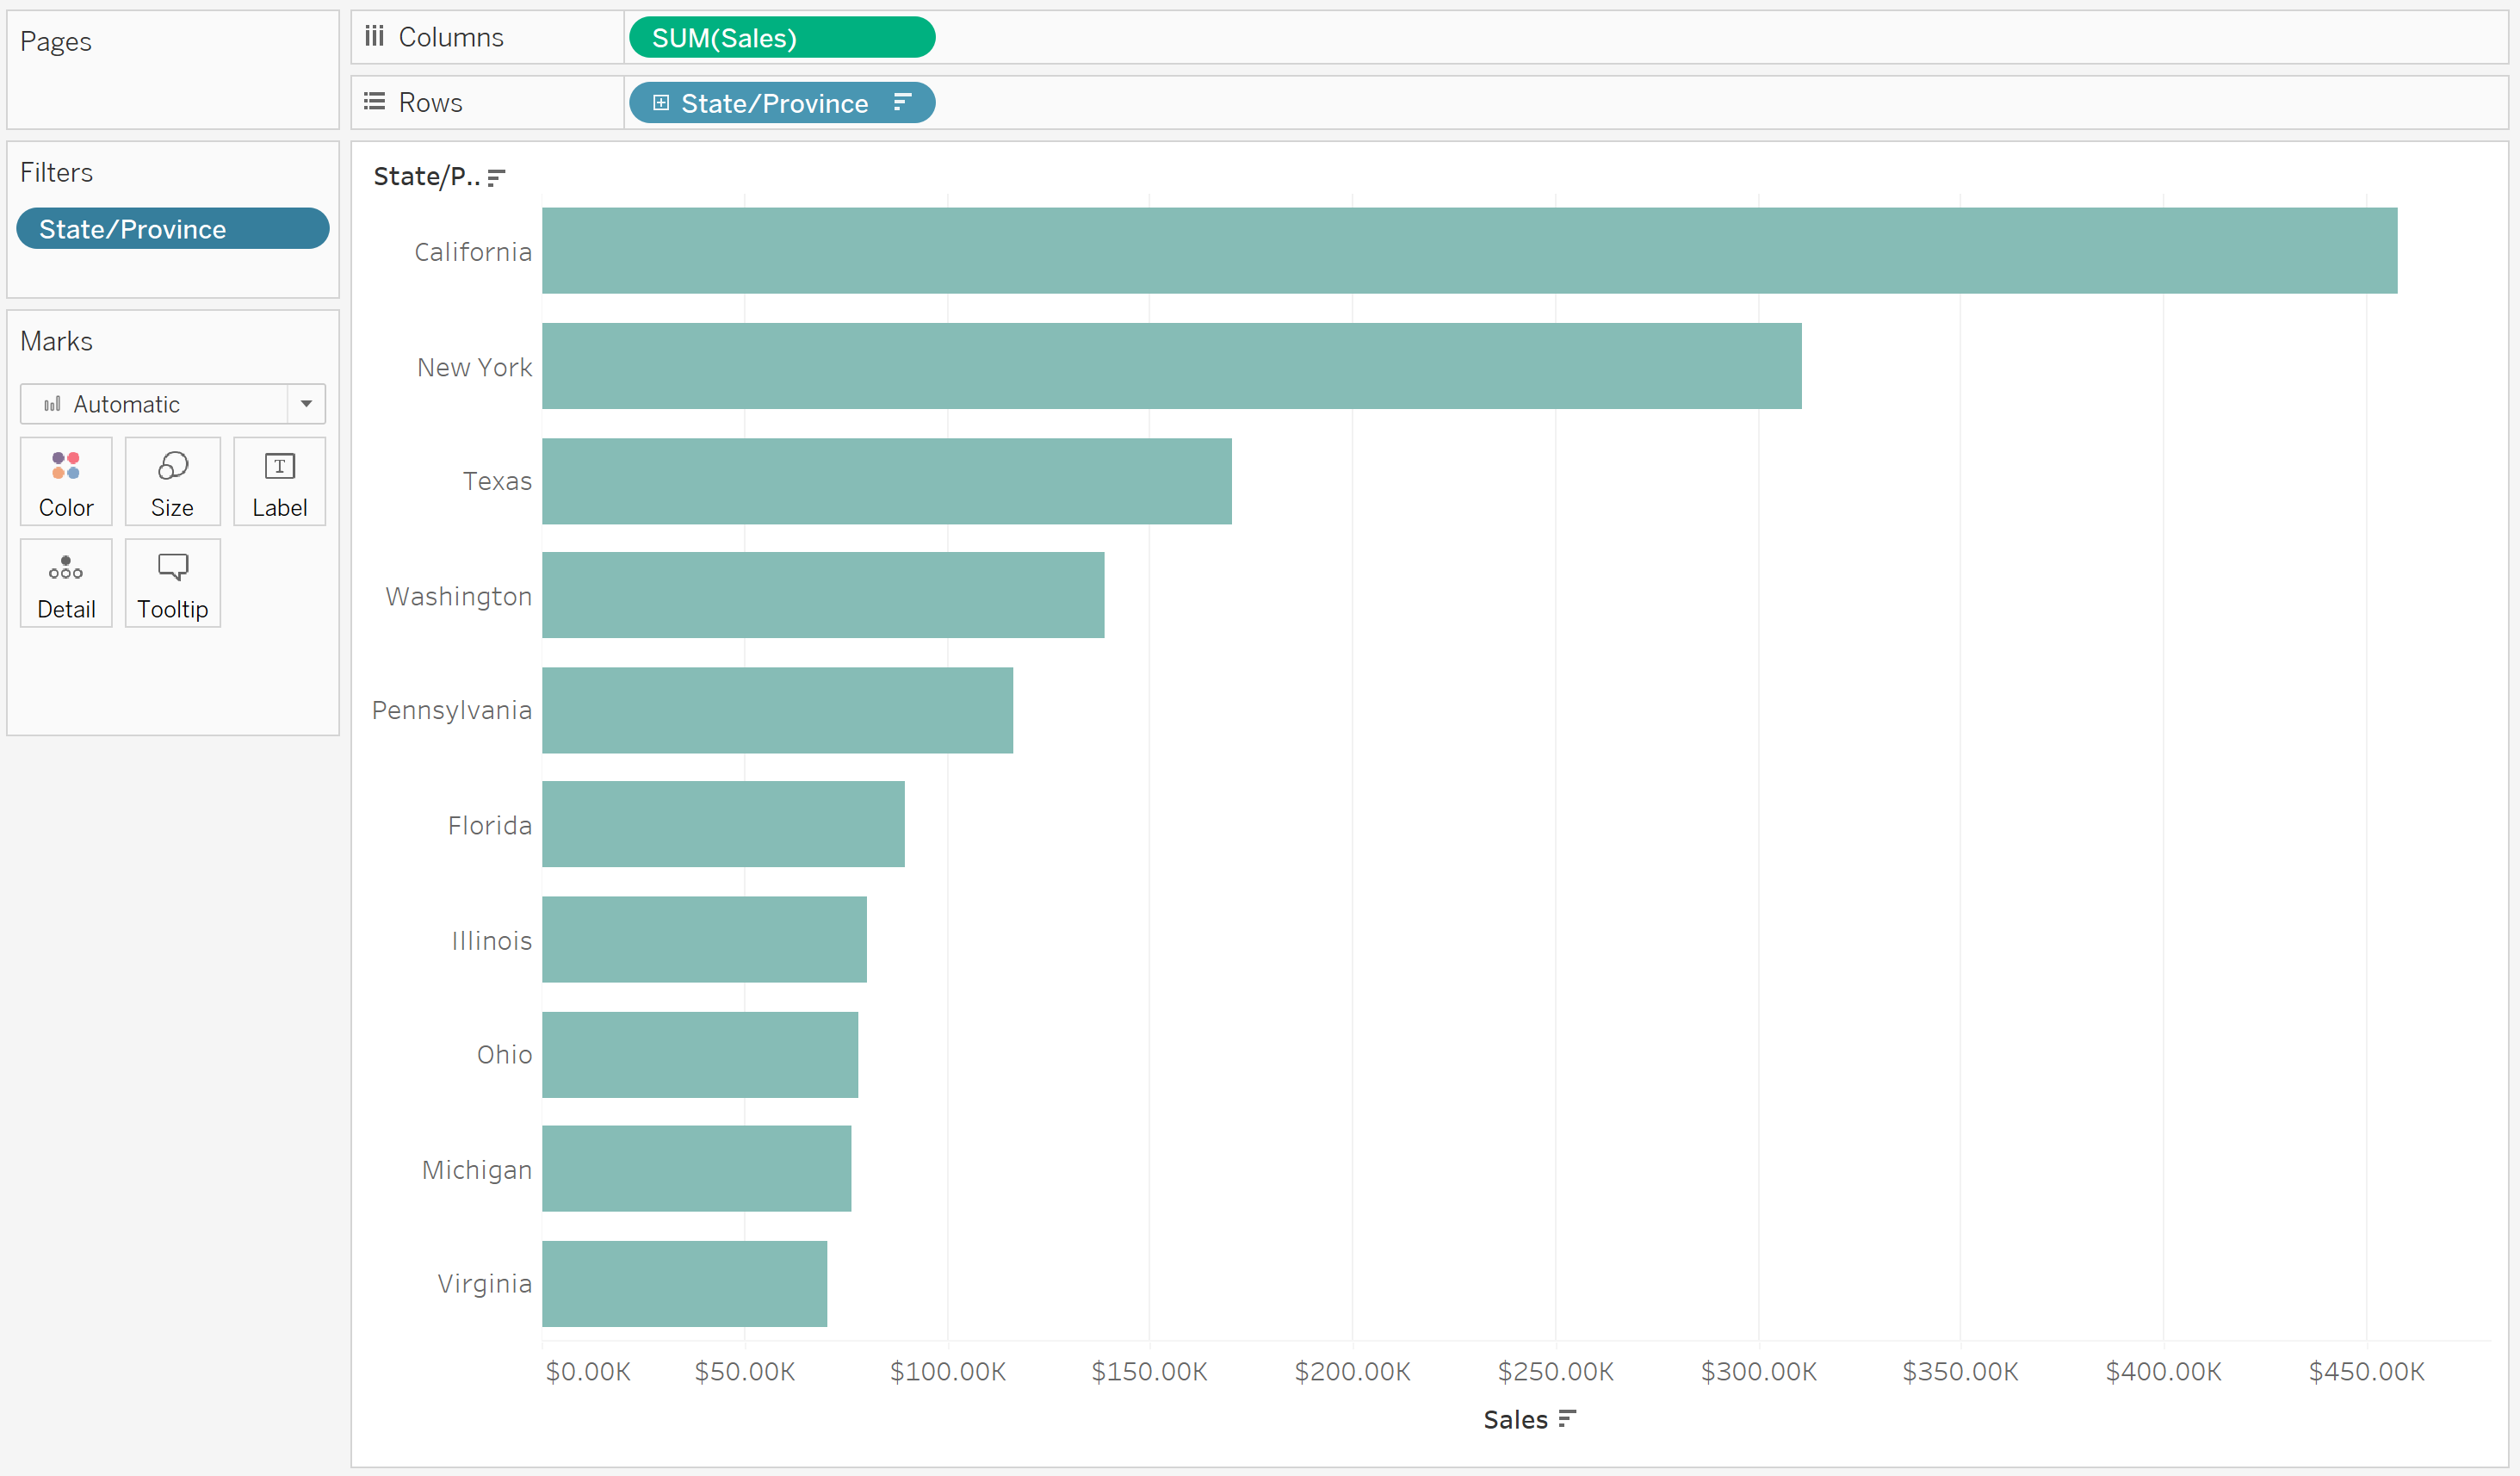
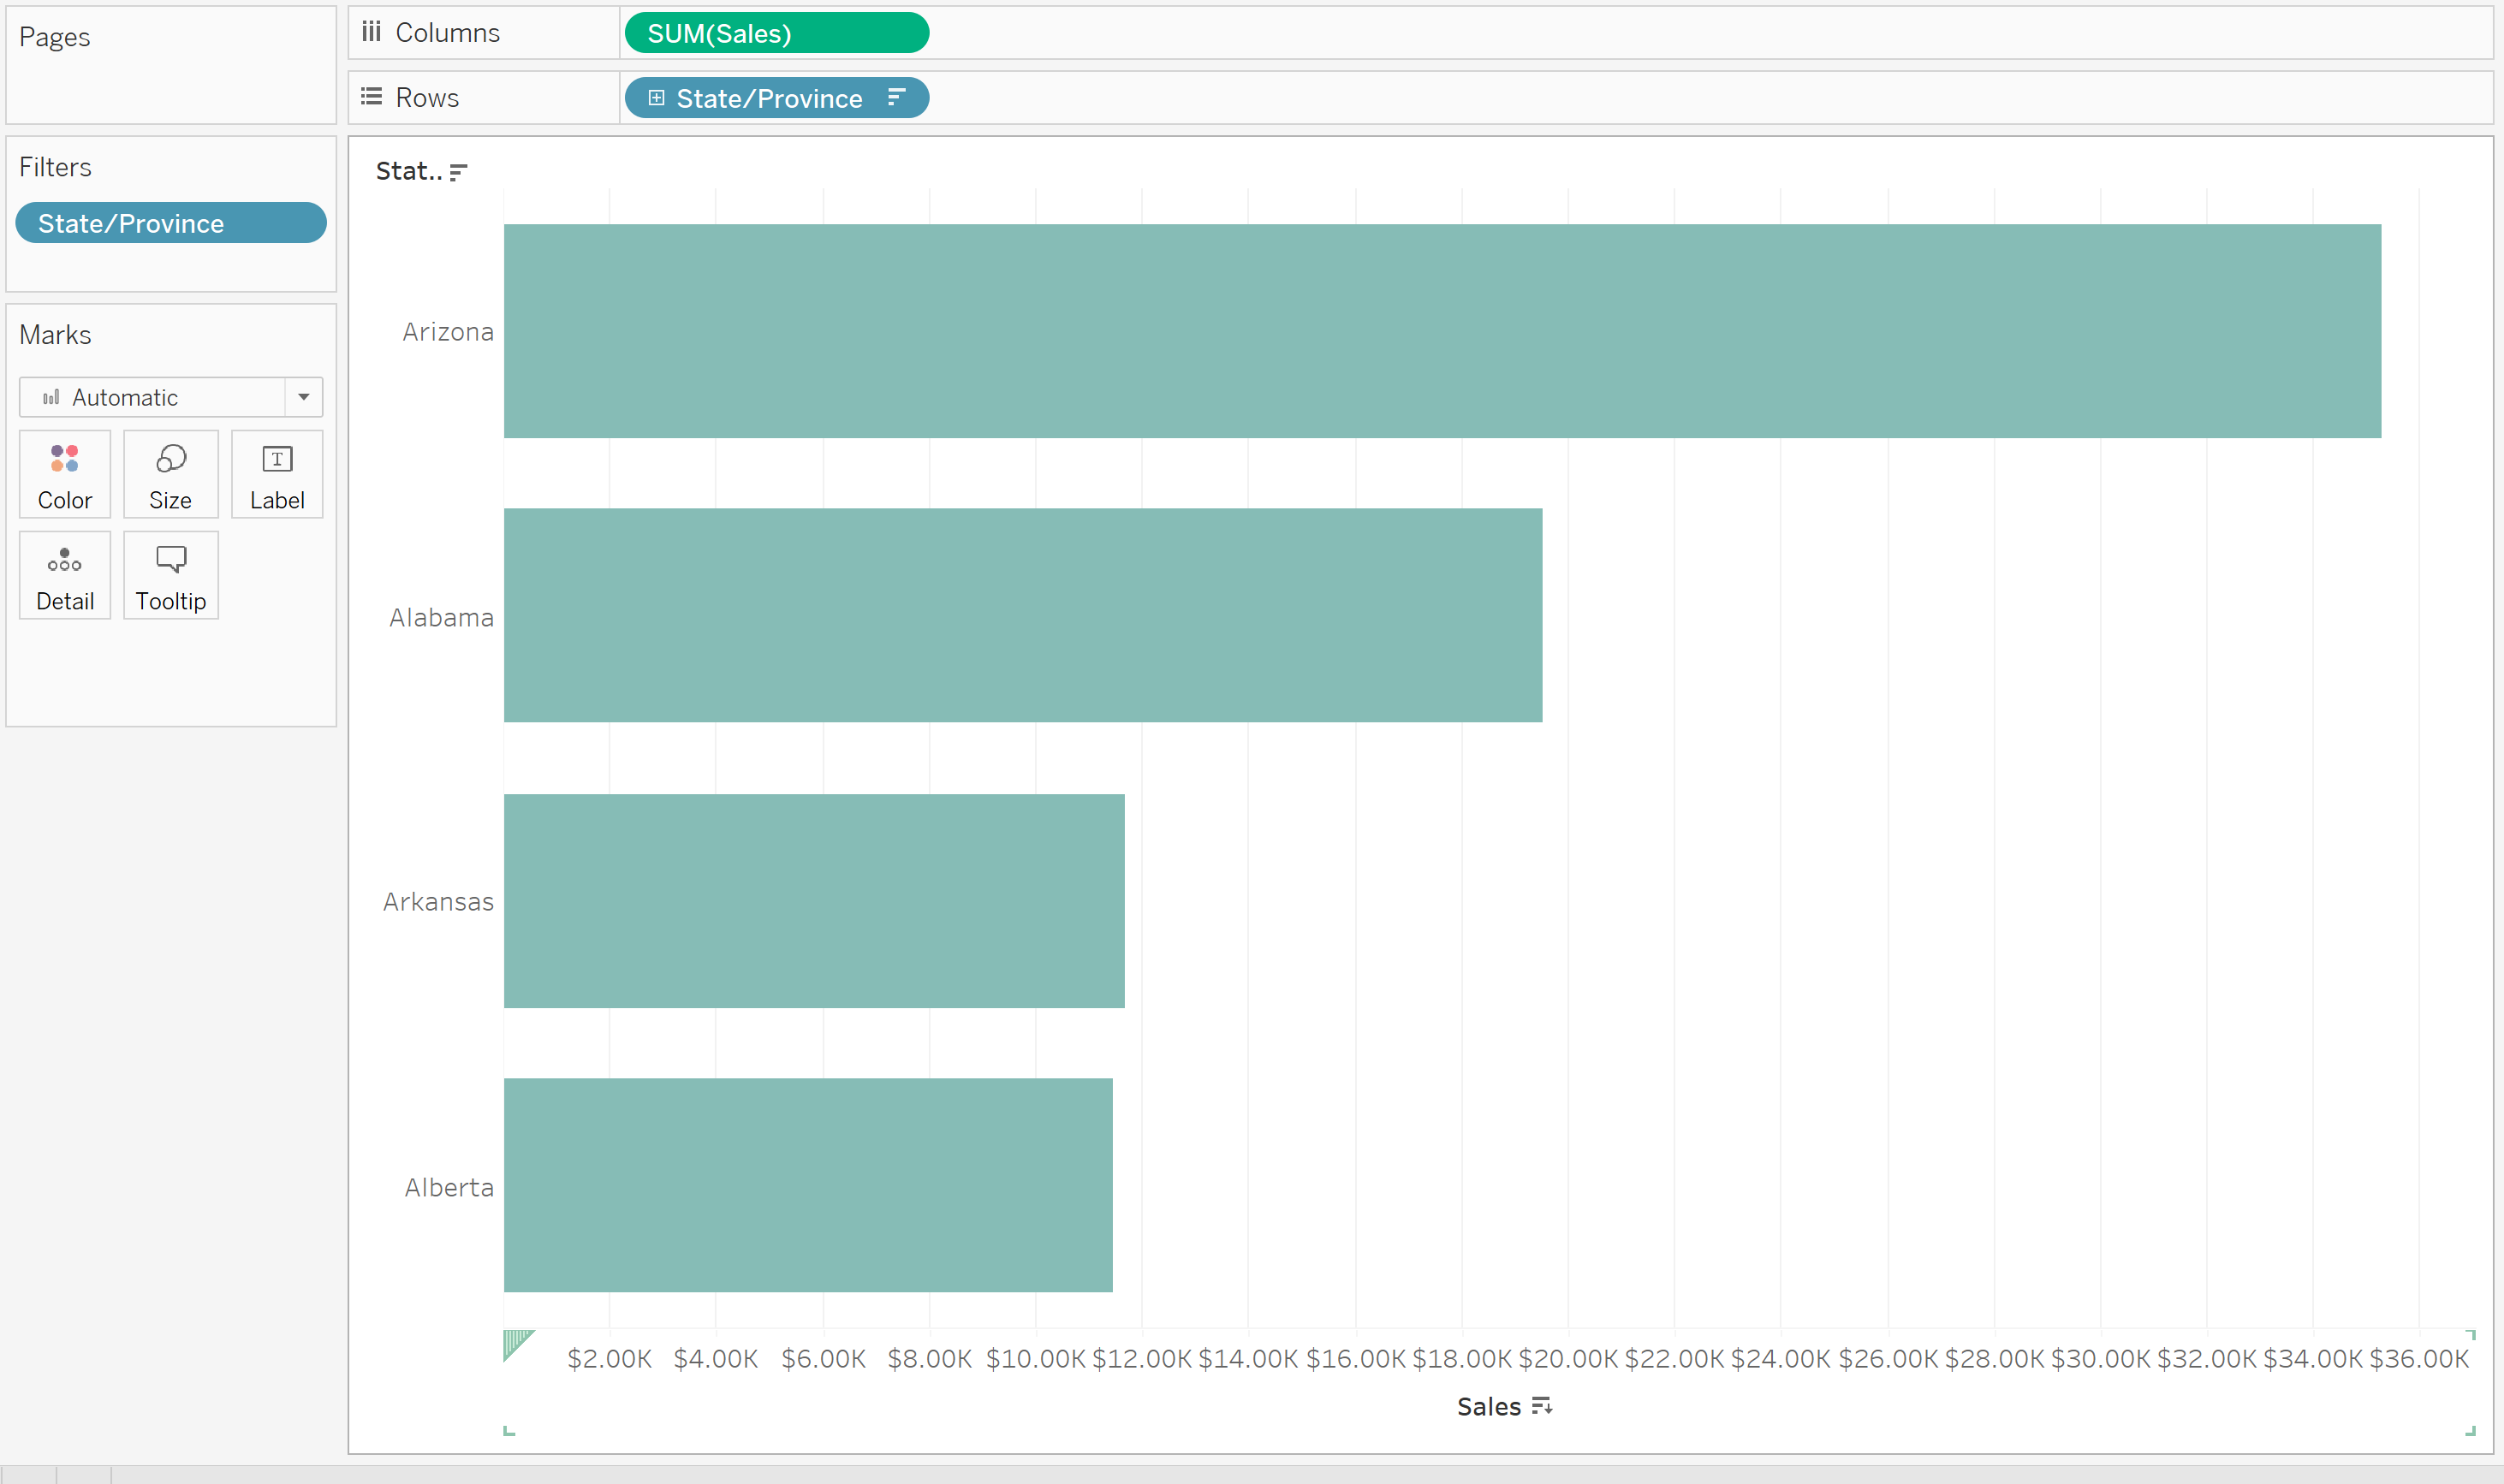
So, if your chart is looking something like this:
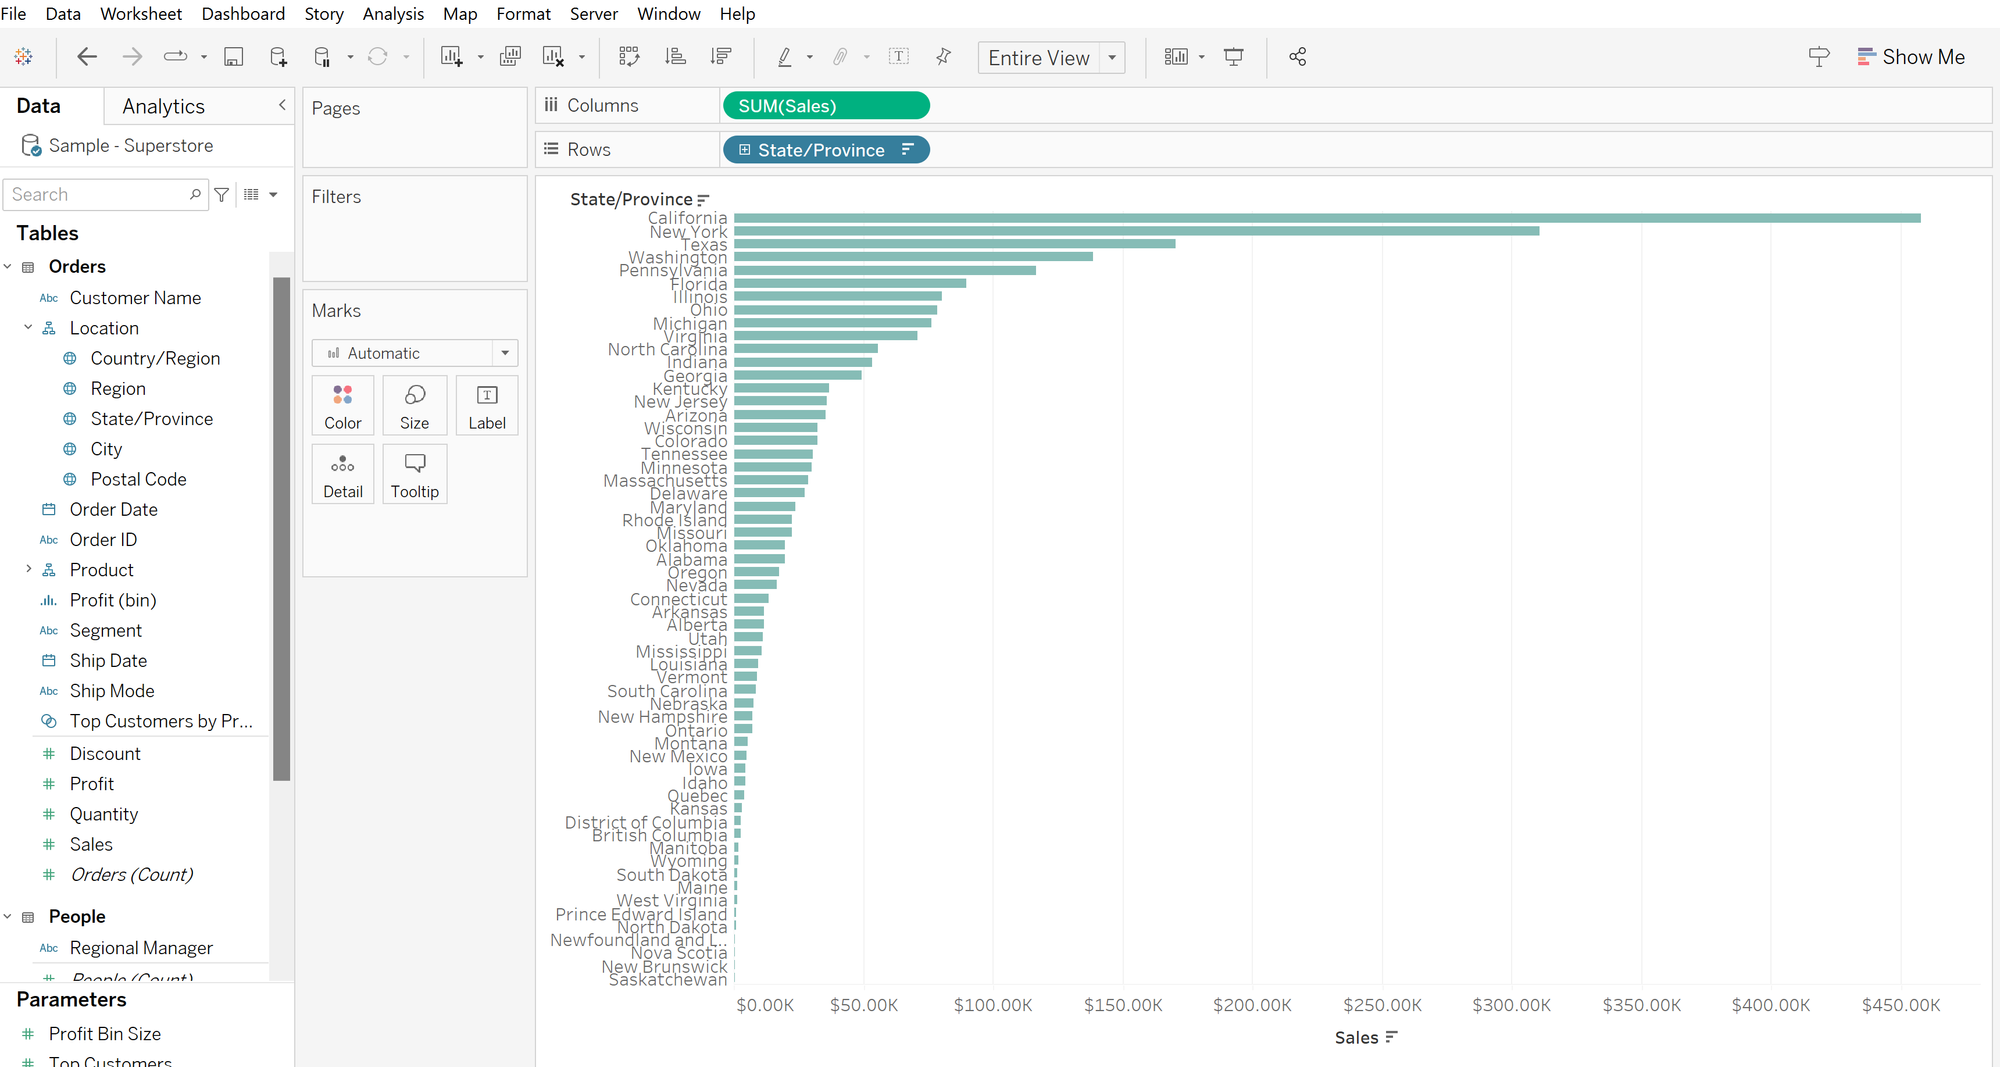
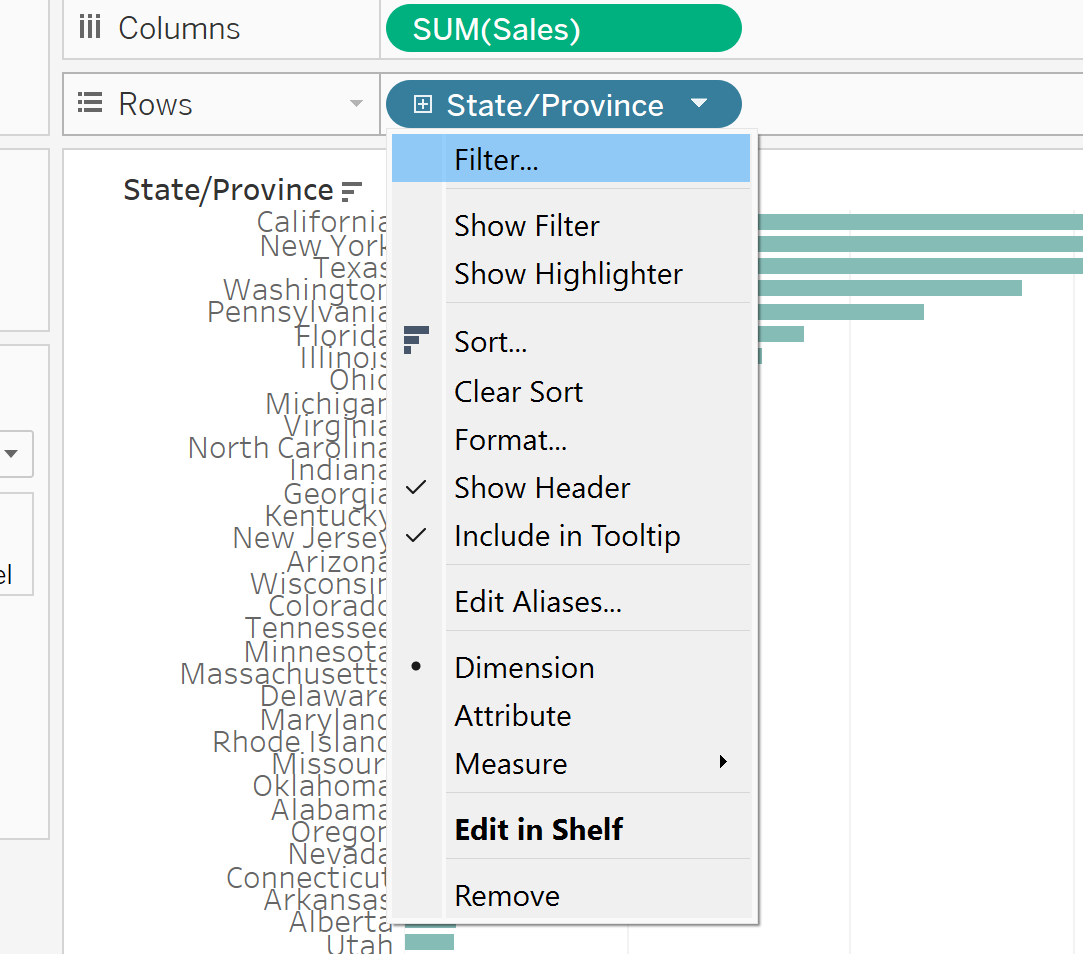
And you only want to look at certain values in your dimension field, you can add a filter by either clicking the small arrow by your dimension pill or dragging it into the filter pane.
Four different filtering options will be available for you to pick depending on your desired outcome. For each type, I have made an example of what you can filter out, but there are many different combinations of filters you can do so the options are endless.
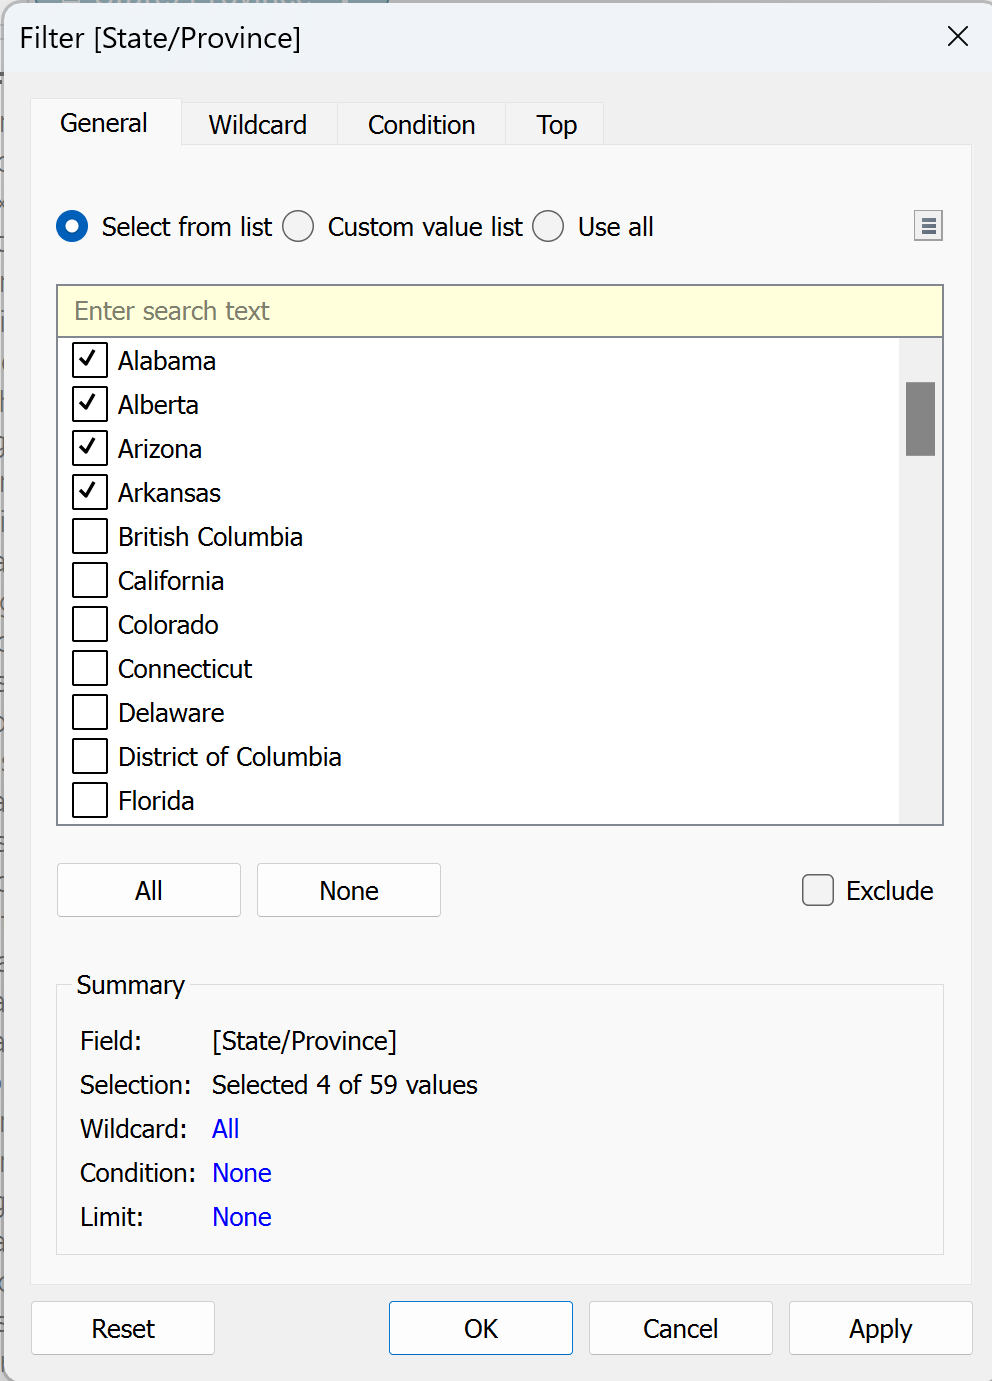
Firstly, the general filter (as shown above) will give you the option to individually select each value to either include or exclude them from your chart, depending on whether the exclude tick box is ticked (found below the scroll).
Also take note of the summary box at the bottom of this window as it will show you what filters you have on your data and if you come into any filtering problems this is where you should look first.
In this example, as the exclude box isn't ticked, only the four states starting with 'A' will be included in the chart. As shown here:
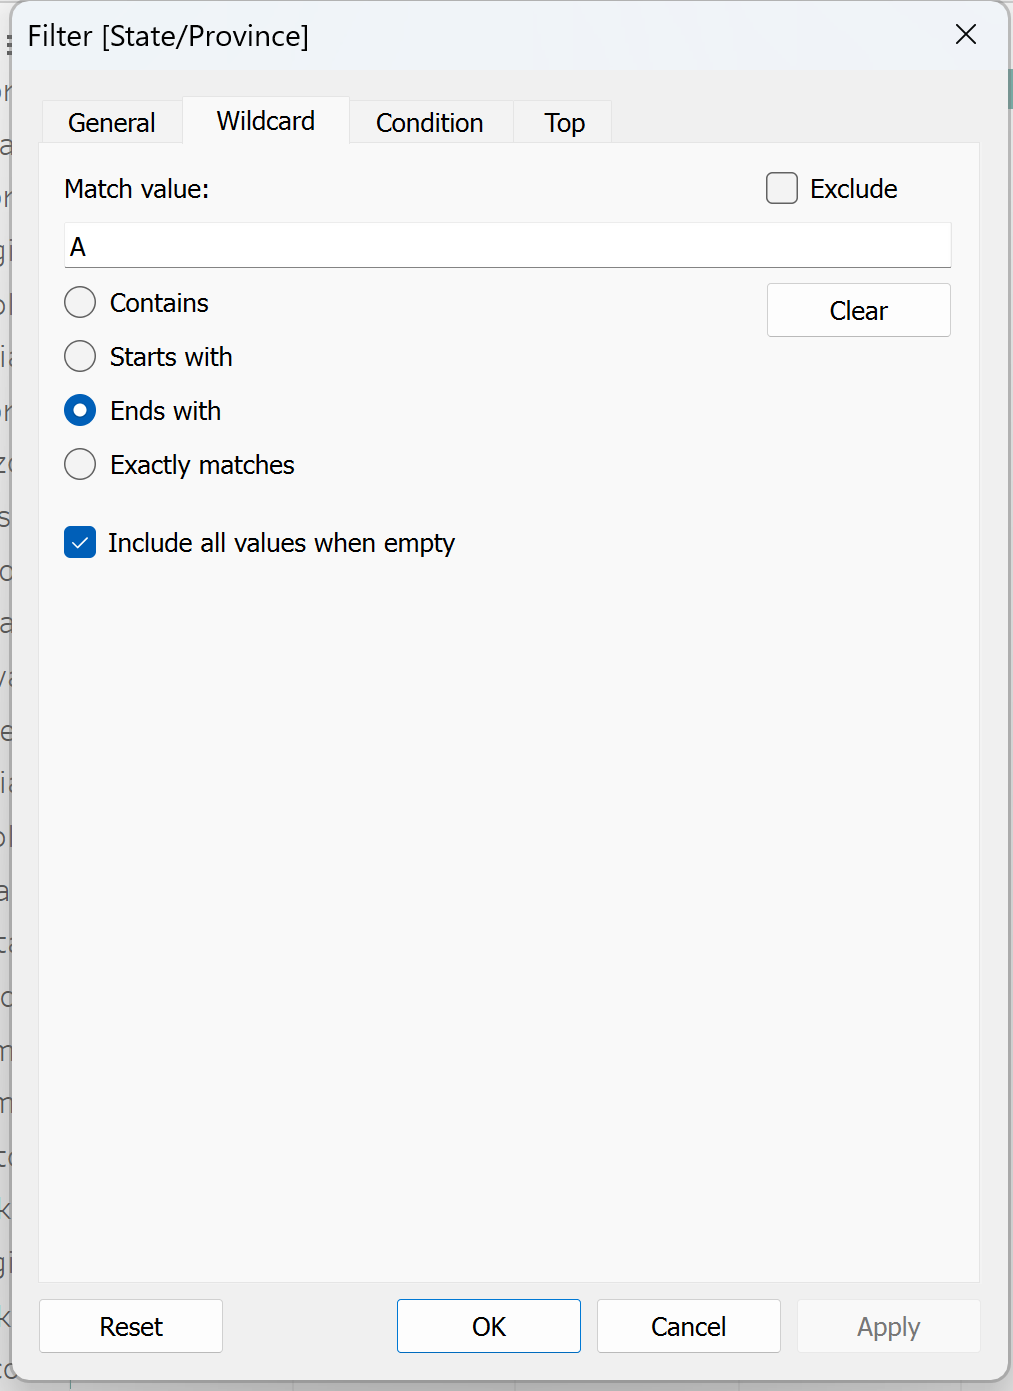
A wildcard filter allows you to include or exclude data by matching a selected value. In this example, I have chosen to include only the states/provinces that end with the letter 'A'.
This wildcard filter results in this chart:
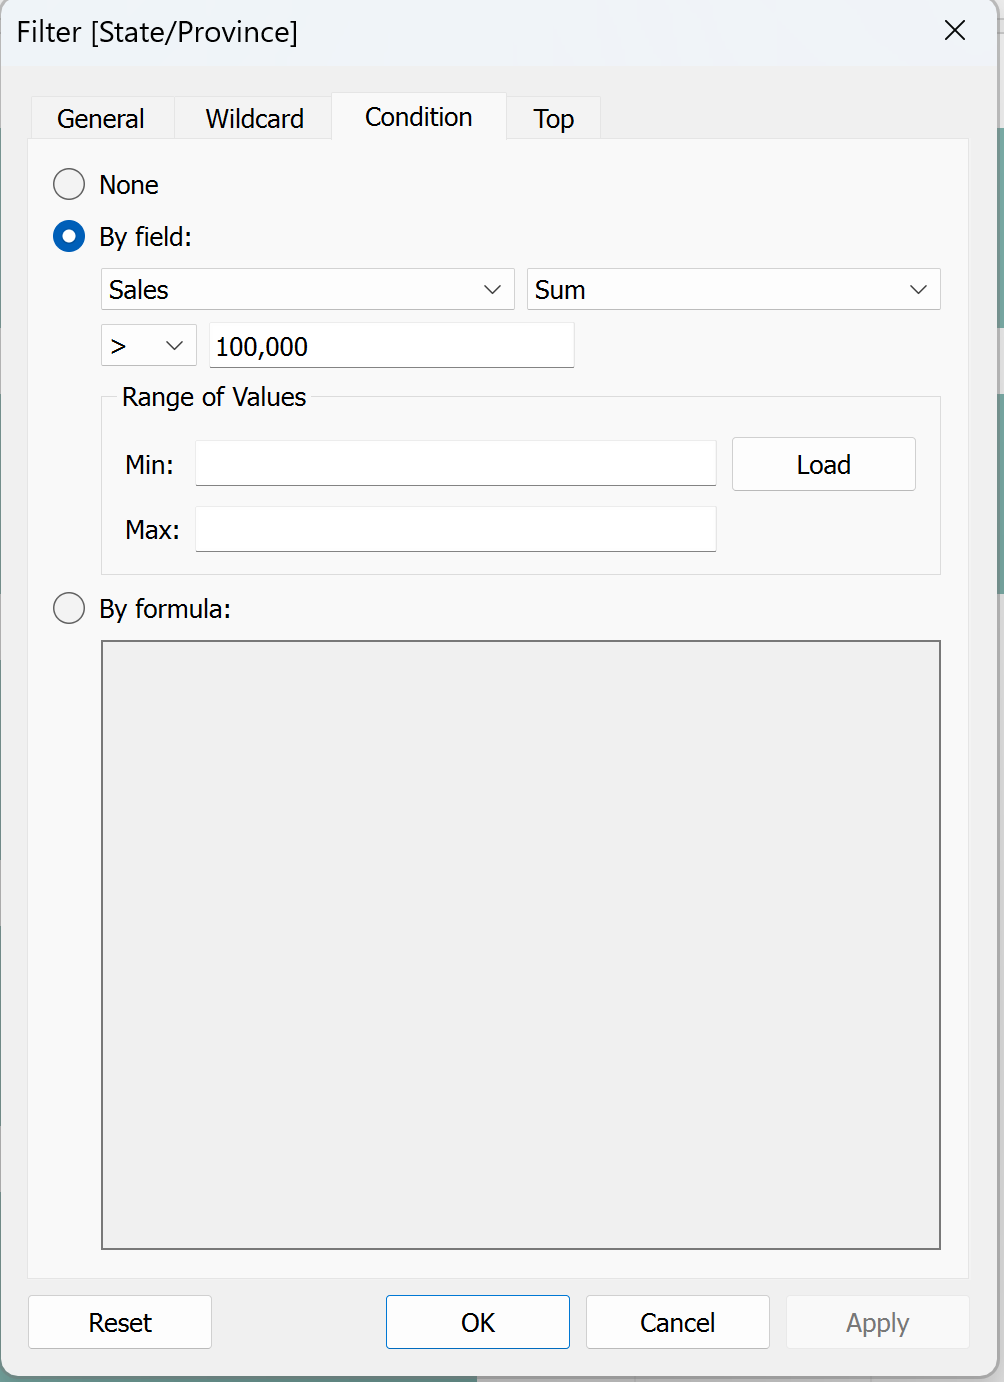
A condition filter allows you to include or exclude values by a desired condition. Here I only want to show the values that have a SUM(Sales)> 100,000.
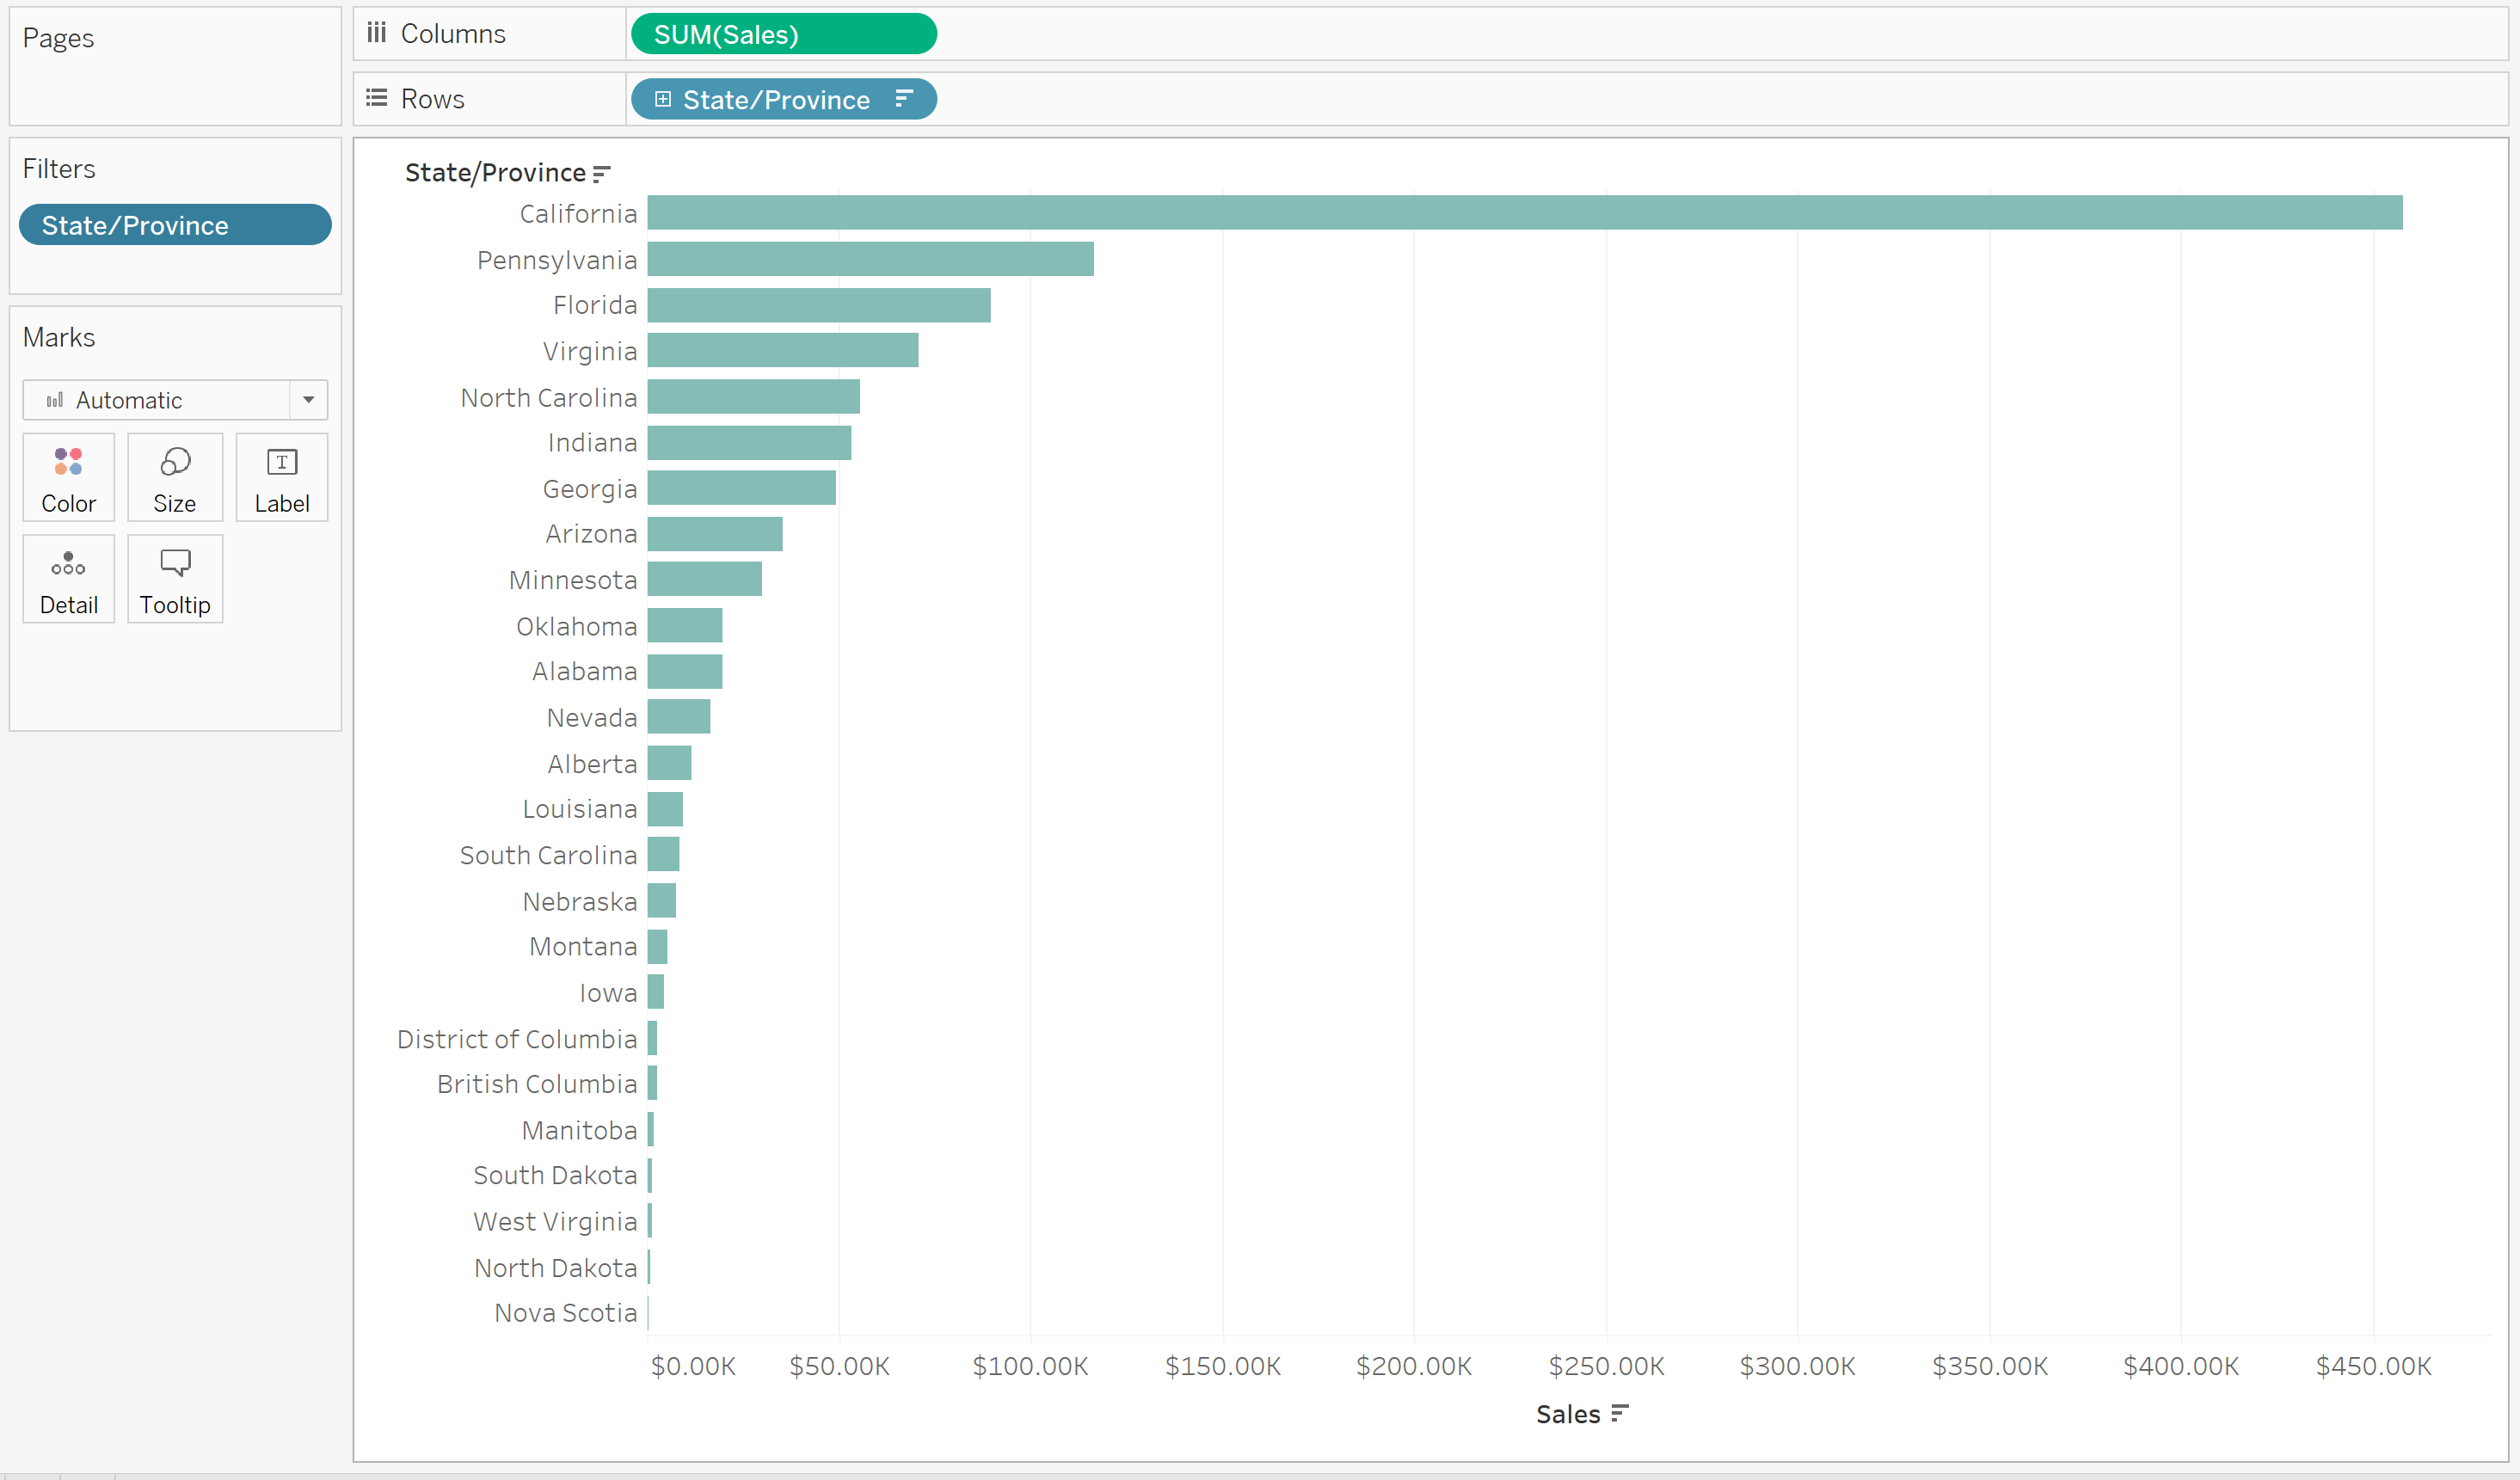
This condition filter results in this chart:
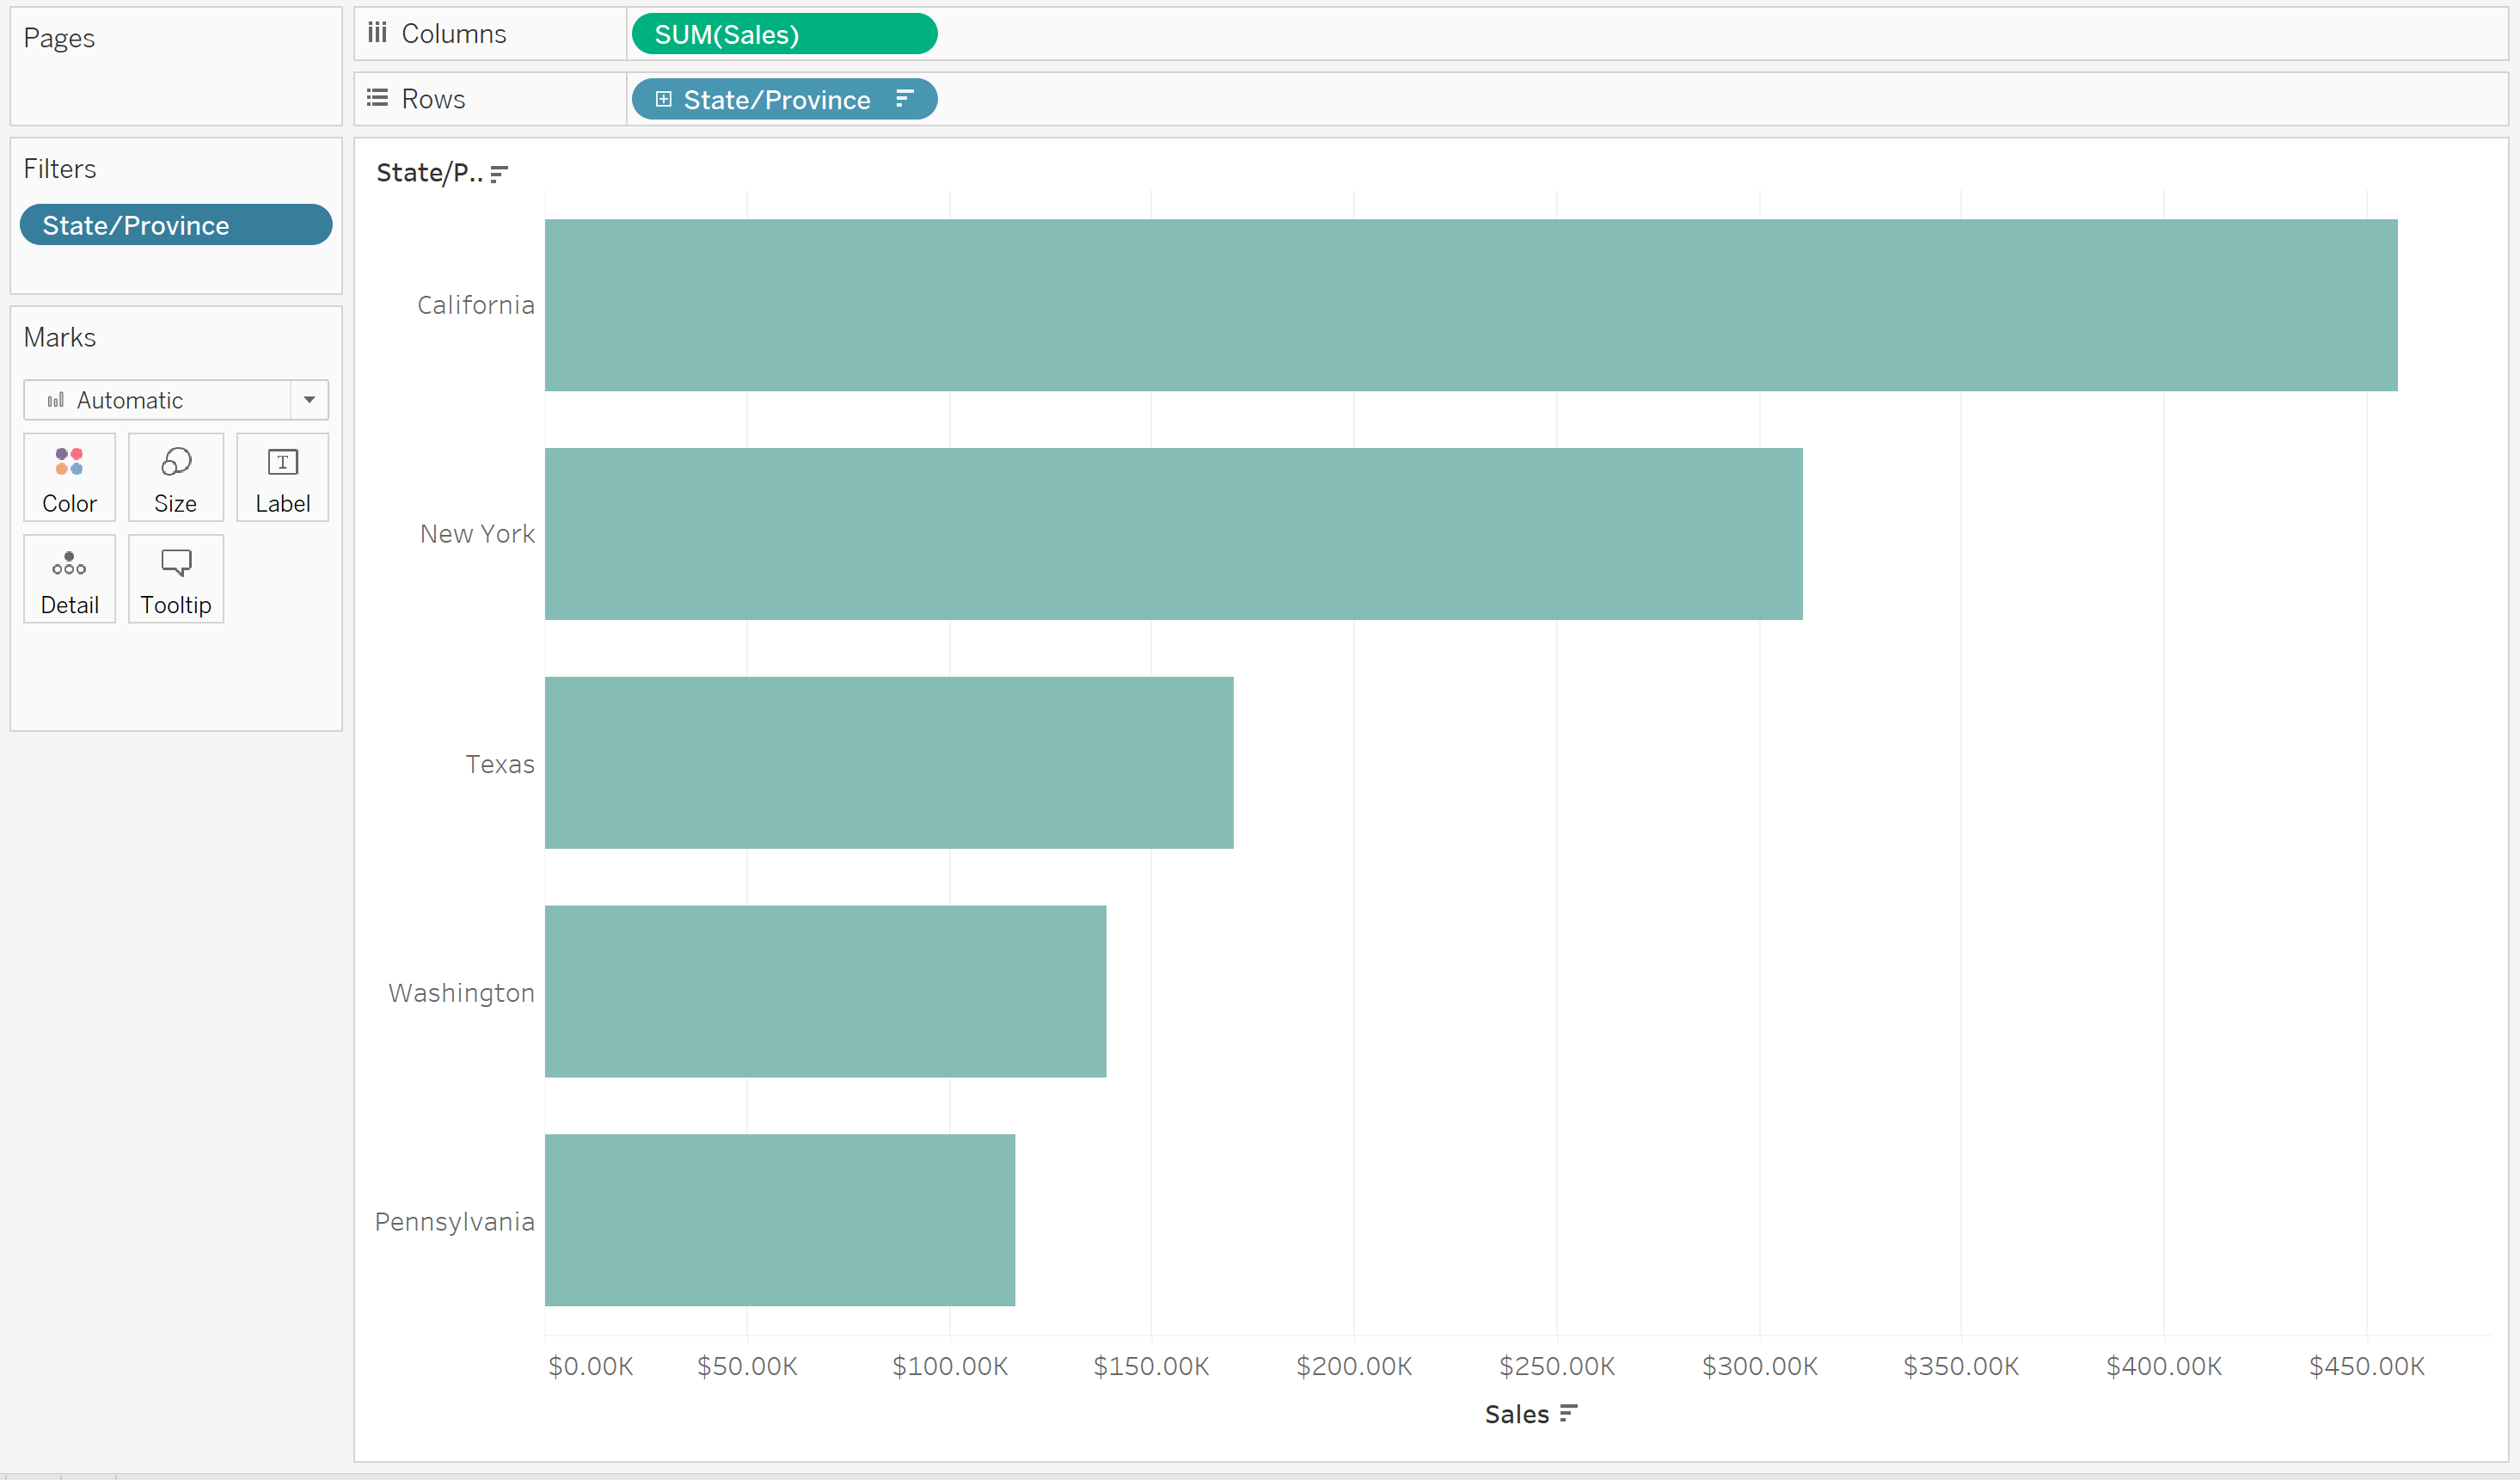
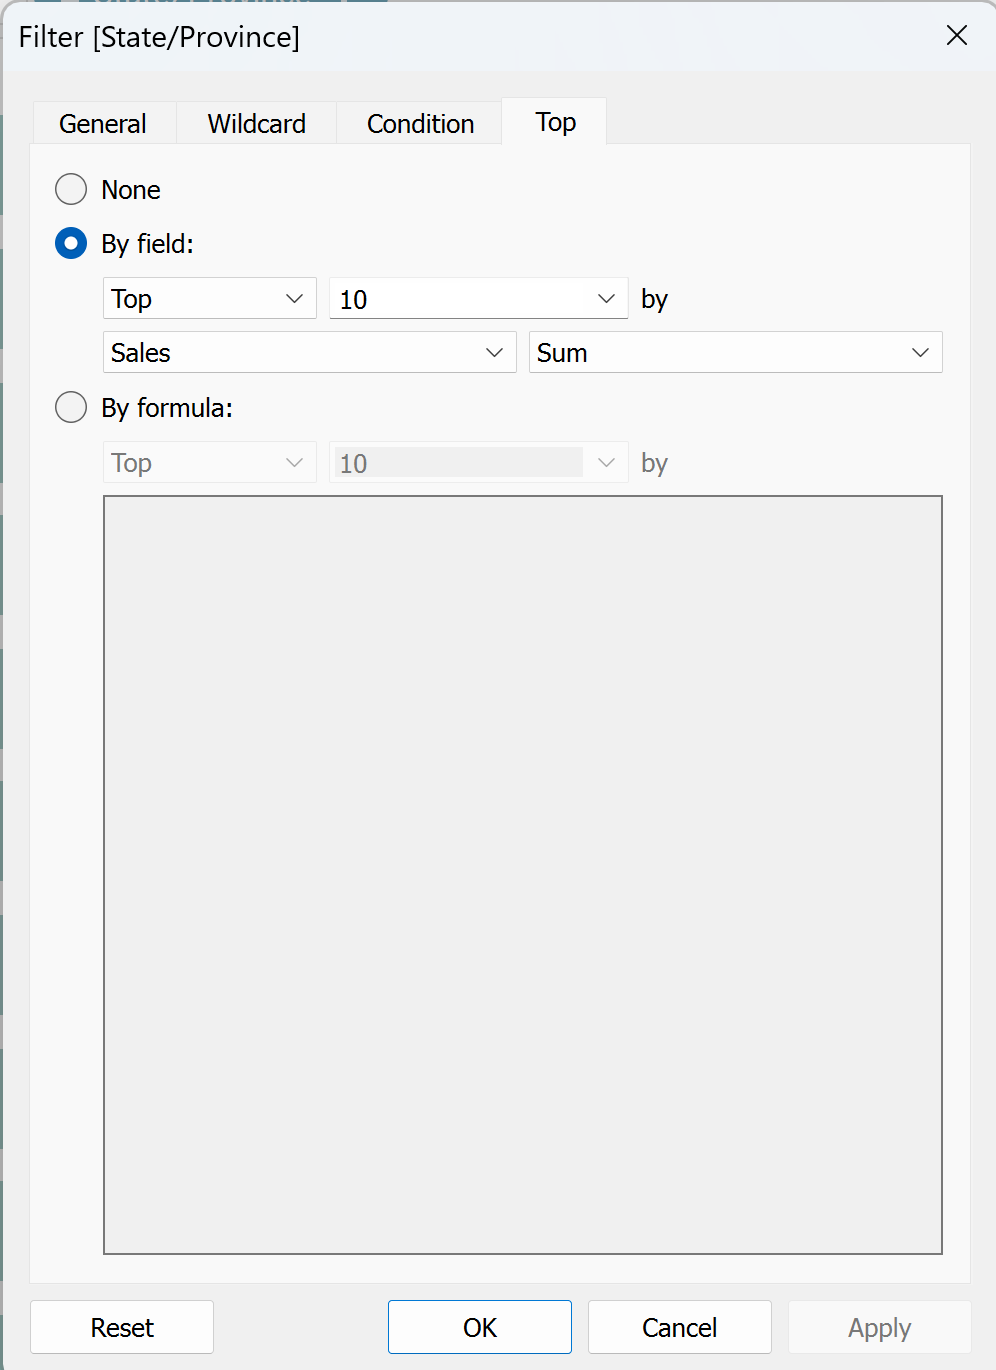
A top filter will allow you to look at the desired number of the top or bottom values for a selected field or by a formula. In this example, I only want to see the top 10 states/provinces with the highest sales.
This top field results in the chart looking like this: