All Data Visualization software have their own quirks and differences. These include but are not limited to their terminology, functionality and design.
I learned this the hard way. Because I started on Tableau and was familiar with the way it worked, I carried a lot of wrong assumption when I started using Power BI.
In this blog, I wanted to highlight the difference between Power BI and Tableau when concatenating (linking/combining) string values so that when you begin to use it yourself, you can skip the Googling and guesswork.
For my examples, I will be using data from Tableau’s Sample Superstore dataset. I want to create a field that contains both the city and state for each order. I hope this information helps!
Tableau
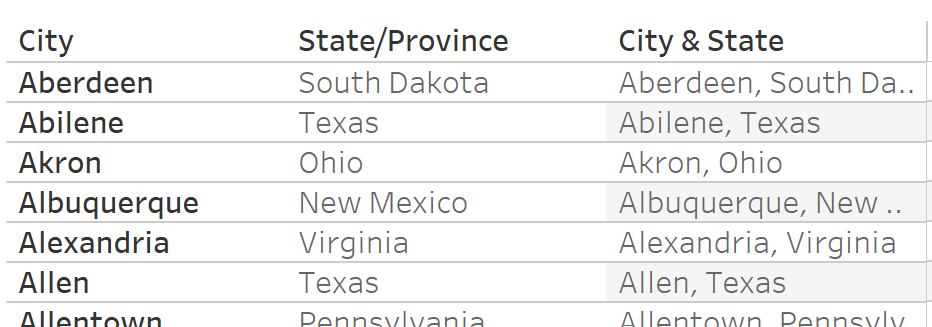
In Tableau, you can concatenate using “+” in a calculated field. In the first screenshot below, you can see how two separate fields; [City] and [State/Province] are concatenated in the calculated field with a “, ” to add a space. The second screenshot shows a table with the result.


Power BI
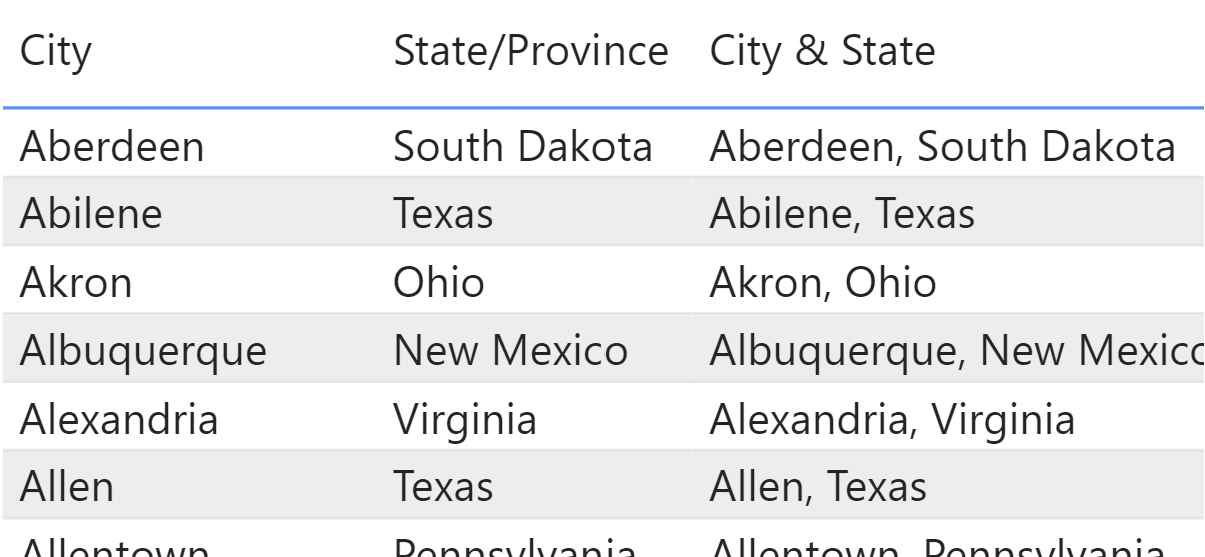
In Power BI, you have to concatenate using “&” when adding a column. In the screenshot below, you can see how two separate fields; [City] and [State/Province] are concatenated with a “, ” to add a space. The second screenshot shows a table with the result.


