Last week we had another break from usual client projects. Instead, the main topic for all the week has been web scraping and APIs. These topics were taught to us by Andre.
This, of course, was a big hint on what to expect for the Friday project presentation session. In fact, last week, my fellow DSers and I have been given the task to produce a visualisation based on data obtained by either web scraping a site or API calls.
Unlike previous projects, the task and the data required were given during the Thursday afternoon session. Thankfully, this gave us a bit of extra time to plan our work.
All of us were assigned different tasks. The task that Robert and I were assigned consisted of web scraping the Data School Blog website, in order to obtain several different metrics about the blog posts and their authors to display in a Tableau chart. On top of that, as an additional challenge, one of the requirement was to create an Alteryx analytic app that would gather the records for one single person and automatically open a Tableau workbook based on this person’s data.
Robert and I spend some extra time on Thursday to build the Alteryx workflow, in order to gain some time for crafting the dashboard on Friday morning. During Thursday evening, after some hours away from the work, I sketched a draft of the dashboard I intended to build, which you can see here.
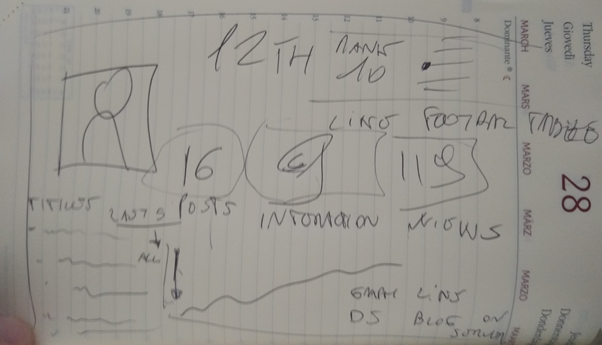
After showing the sketch to my colleague, we agreed on some amendment about the final look of the dashboard, and we then started to work on it. Despite that, we realised that some steps of our workflow needed to be revisited, so we continued to work on that as well as the dashboard.
Here is the final look of the dashboard.
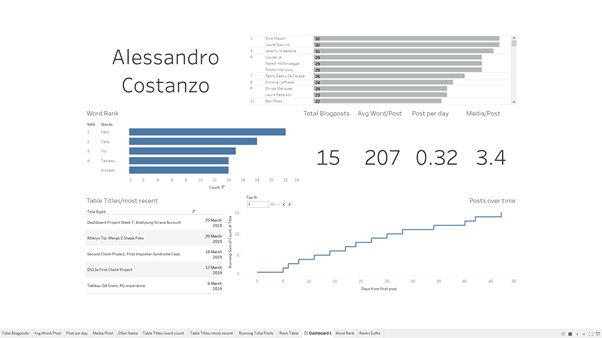
I’m pretty happy with this outcome, although I’m not completely satisfied because I didn’t manage to reproduce every idea that I sketched. I found problems with the data blending, which prevented some filters to work. Due to this, I didn’t manage to include the DSer picture, and to fix the table on the top-right to the selected DSer.
One thing that we should have considered during our planning was how to realise the automatic Tableau launch required. We found a blog post on that, but we tried to implement it too late, due to this, its implementation was unstable. Moreover, we kept iterating on the dashboard till 12, leaving no time at all for rehearsal. Andy’s and Andre’s feedback highlighted these areas of improvement. It is now my objective to work on these weaknesses.