Learn how to create a handy 'Info Button' for any dashboard to add context or extra information without compromising design or using up valuable space.
Find an image of the info icon you want to use. I like a traditional i :

Ideally choose an image with no background. Save it as a .png or .jpg in your Tableau Repository using the follwoing file path:
My Tableau Repository > Shapes > My Custom Shapes
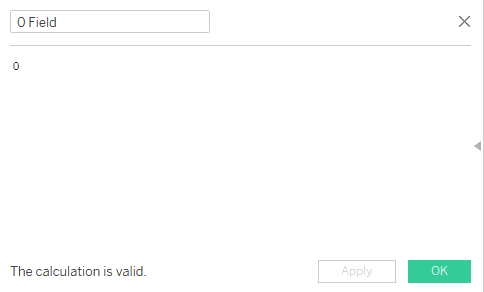
In Tableau, create a calculated field as shown below:

Drag this field onto rows - it is going to act like a dummy field.
Change the chart type to Shape. Click on Shape in the Marks card, then More Shapes... . Click Reload Shapes. Click the drop down underneath Select Shape Palette and choose My Custom Shapes. Here you will find your Info Button, so select this shape.
Untick Show Header on the y-axis of the chart, remove zero lines from the sheet, set the chart to entire view, and hide the title.
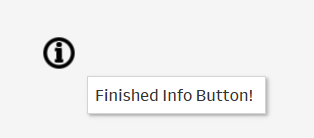
Put the information you want to be displayed by the Info Button into the tooltip of the chart.
Your Info Button is ready to go! Drag the Info Button sheet onto a dashboard and resize as desired. The information will be displayed when the Info Button is hovered over.

