


Hull House Maps and Papers is a publication from 1895 (consisting of essays and statistical information) about the living and working conditions in the worst slums in Chicago around that time. Florence Kelley led the project, and the book produced was not just comprehensive but understandable to a wide audience. As part of the project, Kelley produced a set of stunning maps that are now regarded as classics. I chose to look deeper into the maps because Kelley was a trailblazer for women, who set out to help those in underprivileged positions. I also admired the aesthetics of her visualizations which were drawn masterfully by hand.
The information in the maps was collected by Kelley as part of a National study of the slums of Baltimore, Chicago, New York and Philadelphia. Kelley was the director of the Chicago portion of research. The maps document socioeconomic data from neighbourhoods largely inhabited by immigrants. Some immigrants arriving already impoverished, the conditions that they met when they arrived were horrific. Slum housing was overcrowded and in a state of decay. Kelley and the research team went into housing and sweatshops, asking people about their ethnic origins, how many people they lived with, their wages and for how long they had been employed.
Information collected through this research was copied every night by the residents of Hull House so that it could be sent to the Bureau of Labour in Washington DC, where other researchers working on the project were based.
Hull House was a settlement house set up to enact positive change in the midst of this crisis. Settlement houses were charities that housed middle class volunteers with working class recipients with the goal of encouraging social diversity and reducing the effects of poverty. Hull House was both residential and a community centre for newly arrived immigrants, offering language classes and other skills-based classes to facilitate integration into American society.
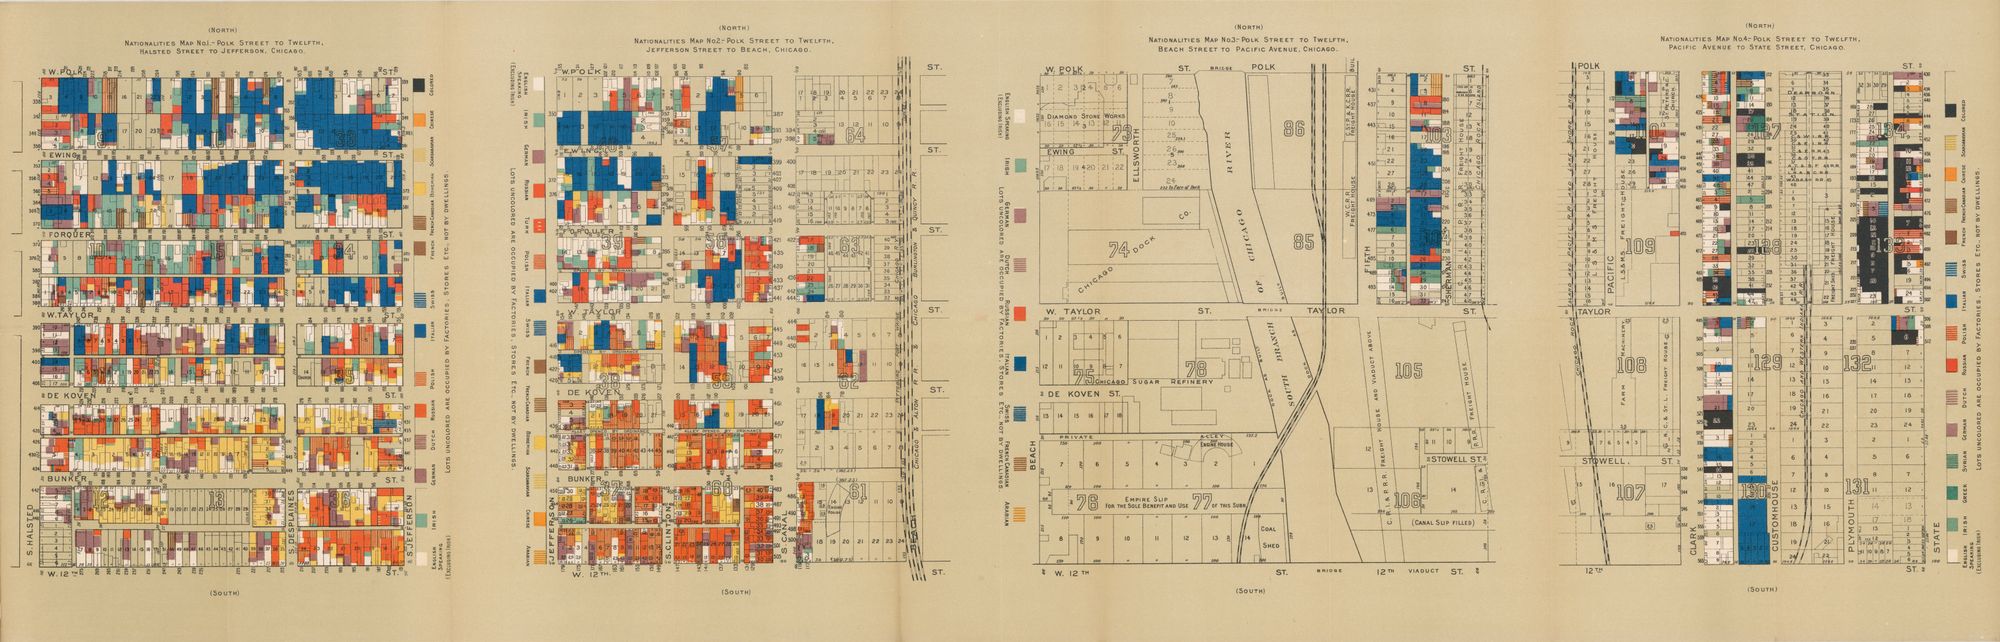
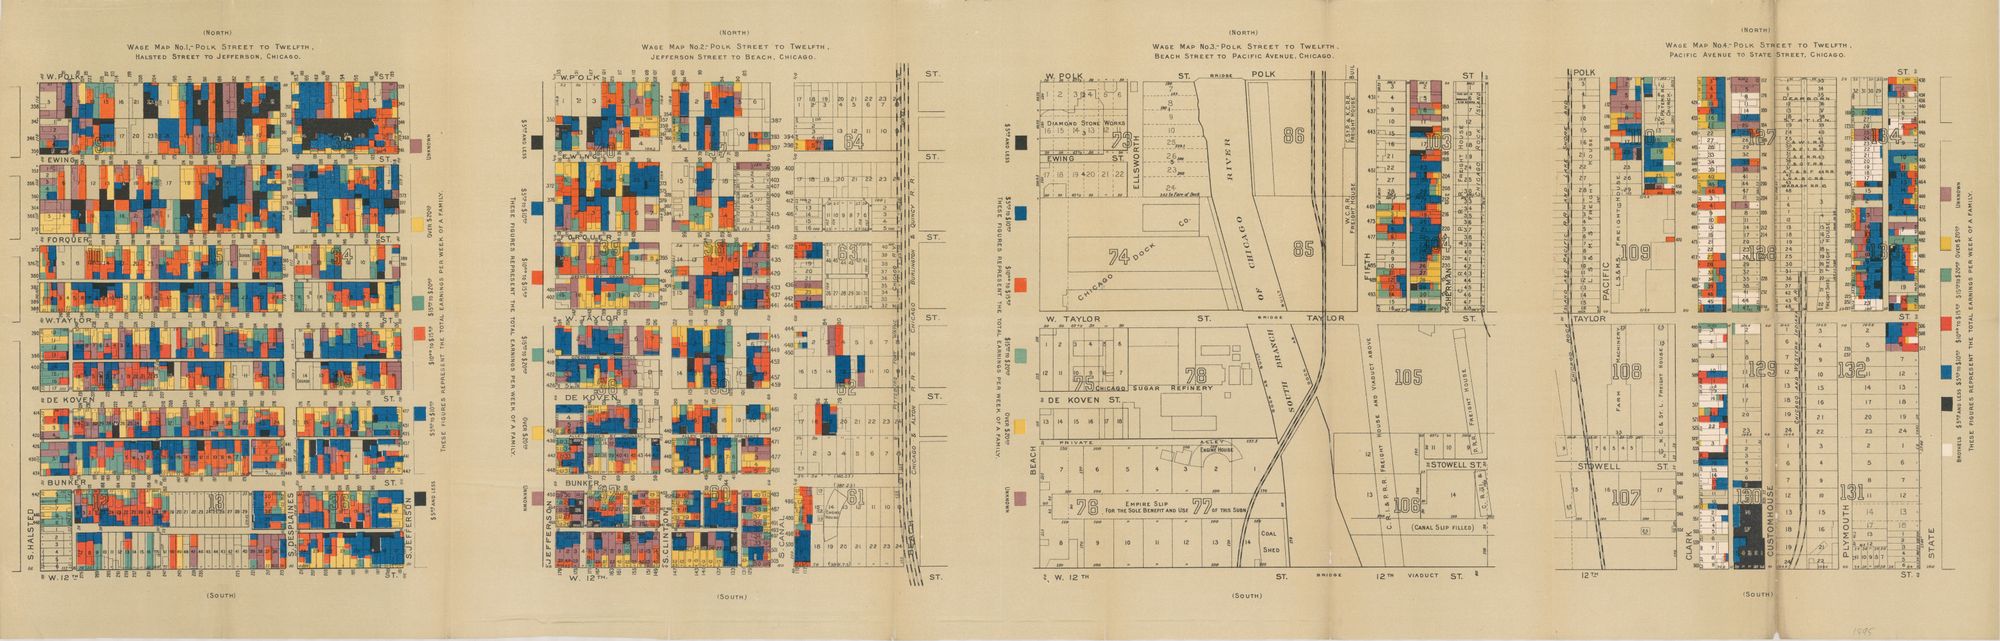
There are two sets of maps which include the same areas of Chicago. One set of maps illustrates the nationality of the people living in the buildings, and the other their weekly household income. Kelley uses colour to represent nationalities and income bands. The maps can be used to determine how successful people are by area, the distribution of nationalities across Chicago and how these two relate to one another when the maps are considered side by side.
The maps also were used to discuss future project plans. For example, a key insight was that the strips of English-speaking people along De Koven and West 12th generally earnt wages in the highest bracket, suggesting that language lessons were important for immigrants in terms of income.
Source: Cornell University Library