For Day 2 of Dashboard Week, we were asked to scrape the German Bundesliga website to get information about the teams’ performance over time (at least 20 seasons). Once we have the data, build an exploratory dashboard.
So the following was I did to accomplish the tasks:
- Alteryx web scraping:
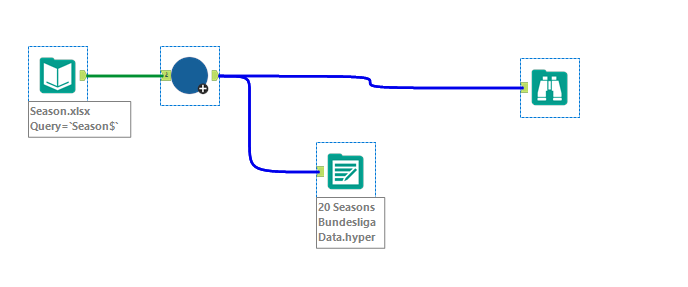
The data acquiring and preparation was divided into two steps. First was to build a workflow that was for scraping one season only:
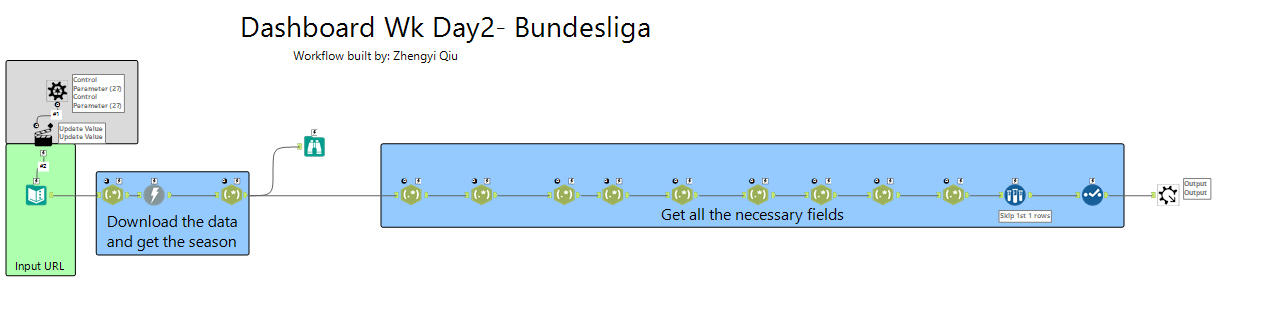
Second step was to turn the workflow to a batch macro so that I could generate the data for all the 20+ seasons. In order to do so, I need to prepare the season data which could be put as an input in the control parameter in the batch macro. I used the Excel autofill handle and concatenate function to do it quickly and then I just build the main workflow that was for scraping the 20+ seasons:
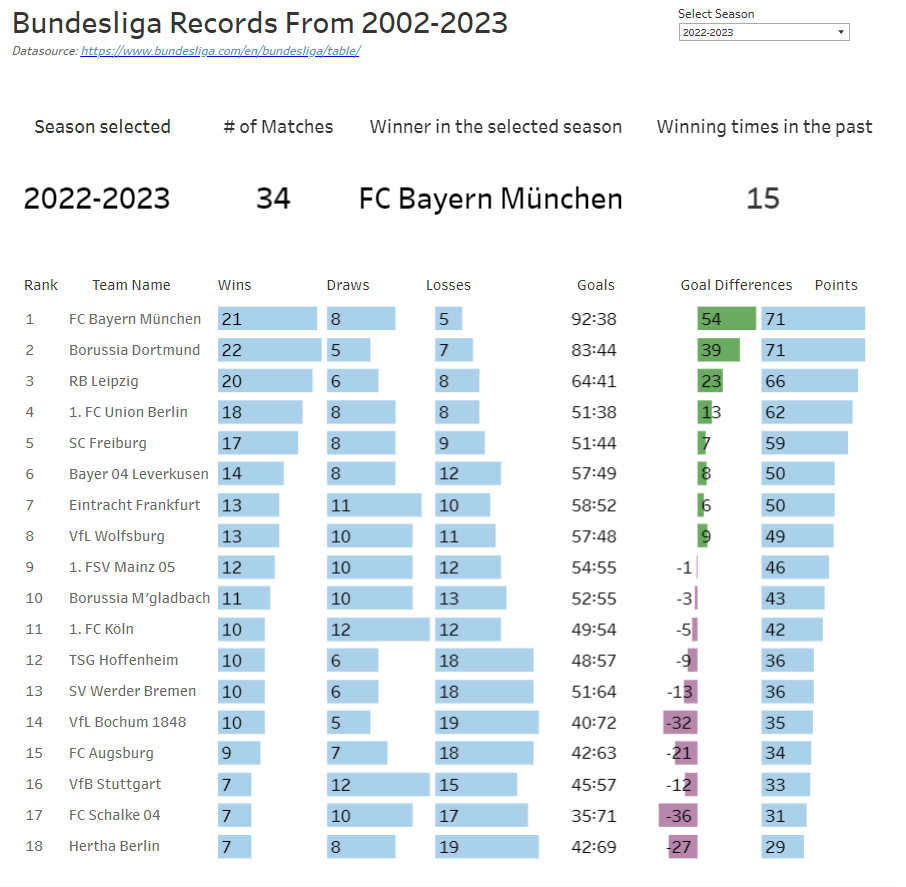
2. Dashboard building:
Because I have limited knowledge of football, I decided to keep the table format but to improve the visualisation and add some bans on the top of the dashboard. Here is my dashboard: