


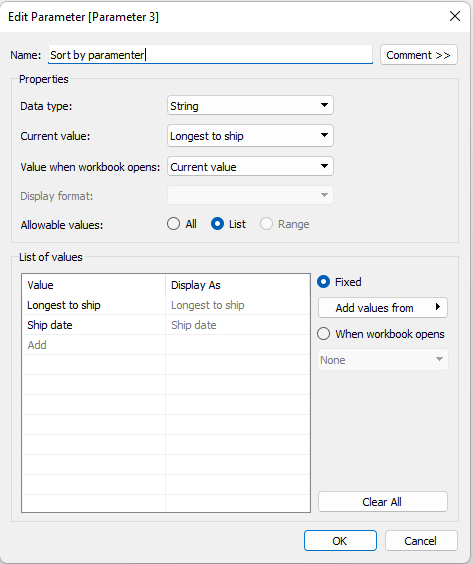
Step 1: Create a sort by parameter.
Step 2: Make a few calculations:
1> for the days it took to ship
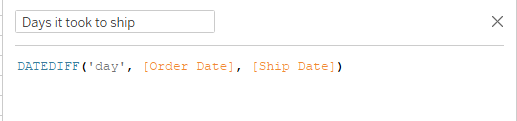
DATEDIFF('day', [Order Date], [Ship Date])
2 > for the parameter
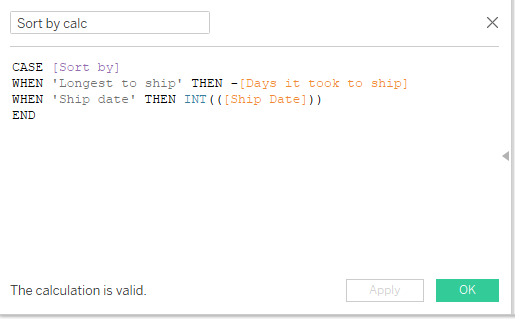
CASE [Sort by] WHEN 'Longest to ship' THEN -[Days it took to ship] WHEN 'Ship date' THEN INT(([Ship Date])) END
Show the parameter in the view
Step 3: Change sort by calc to Discrete and add it to the rows shelf together with Order ID and ship date
Step 4: Add the measure for the days it took to ship to the column shelf and change the chart to a bar chart
We should have this view:
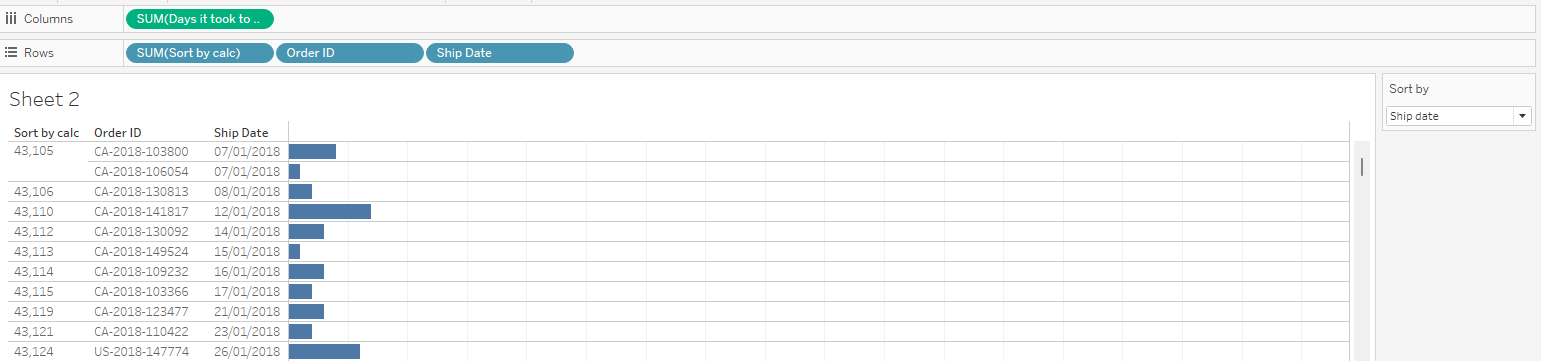
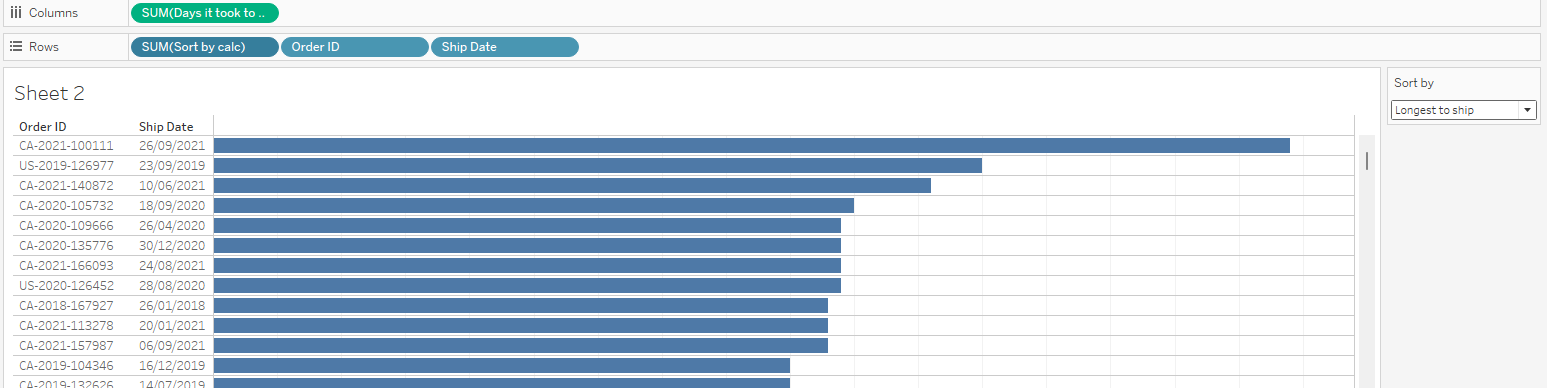
With the parameter we can choose how to have the view sorted. I would hide the Sort By Calc as I only use it for sorting and it is not needed in the view.
Sorted by the longest it took to ship:
Sorted by the ship date:
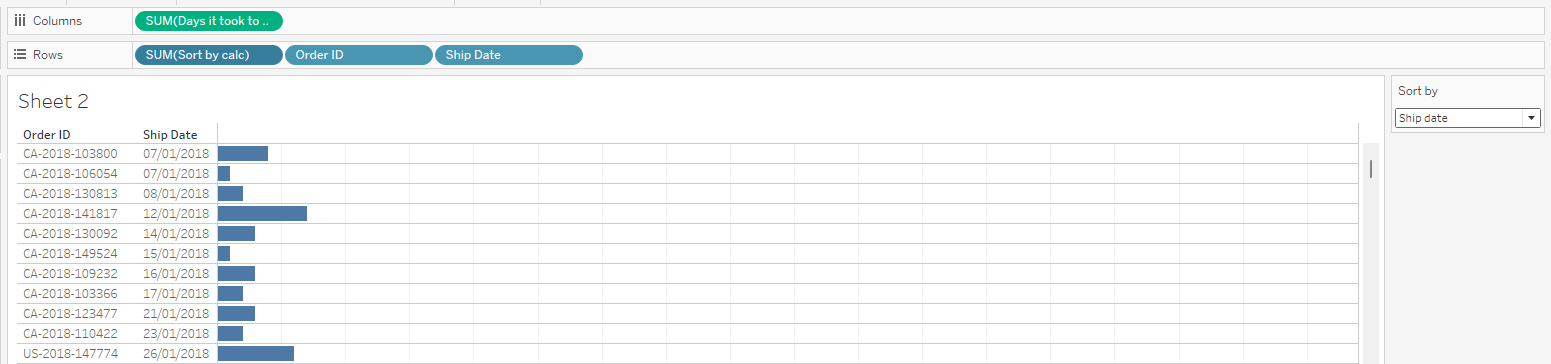
And voila! We have a bar chart with a parameter controlled function integrated!