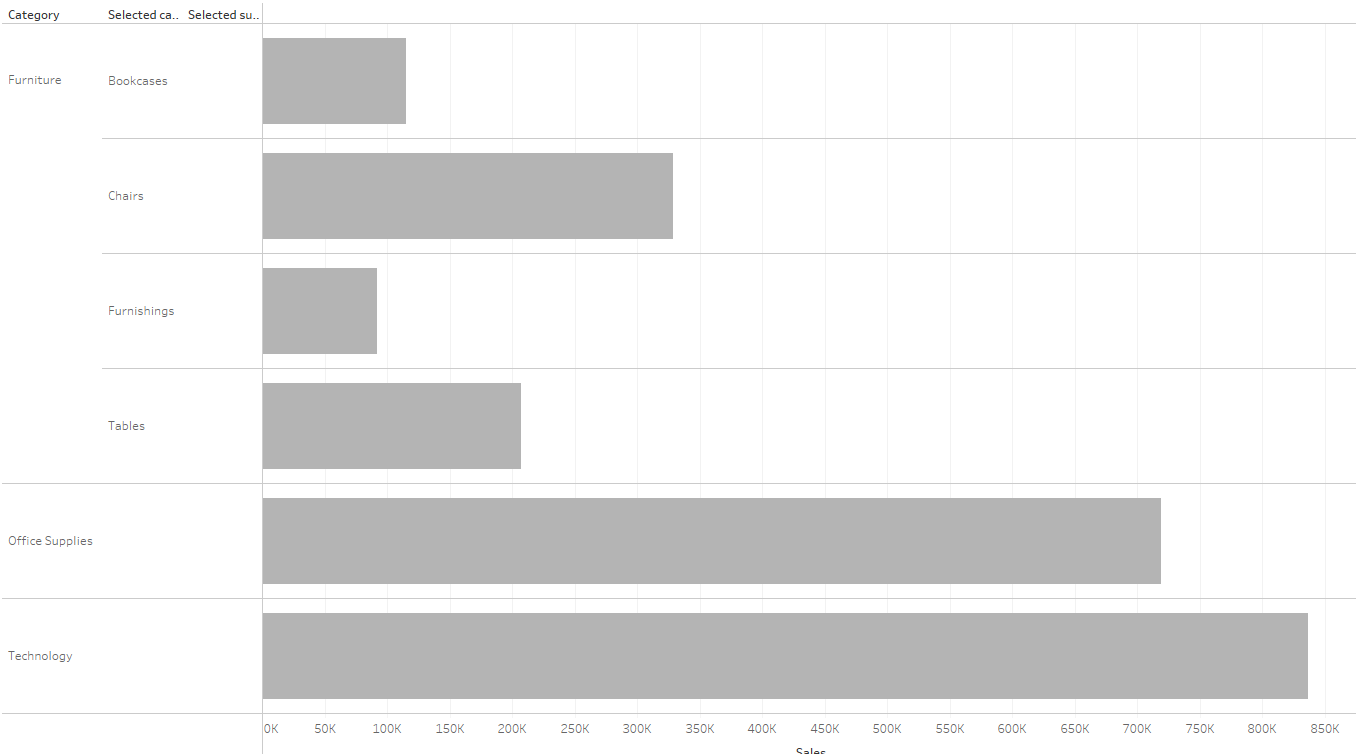
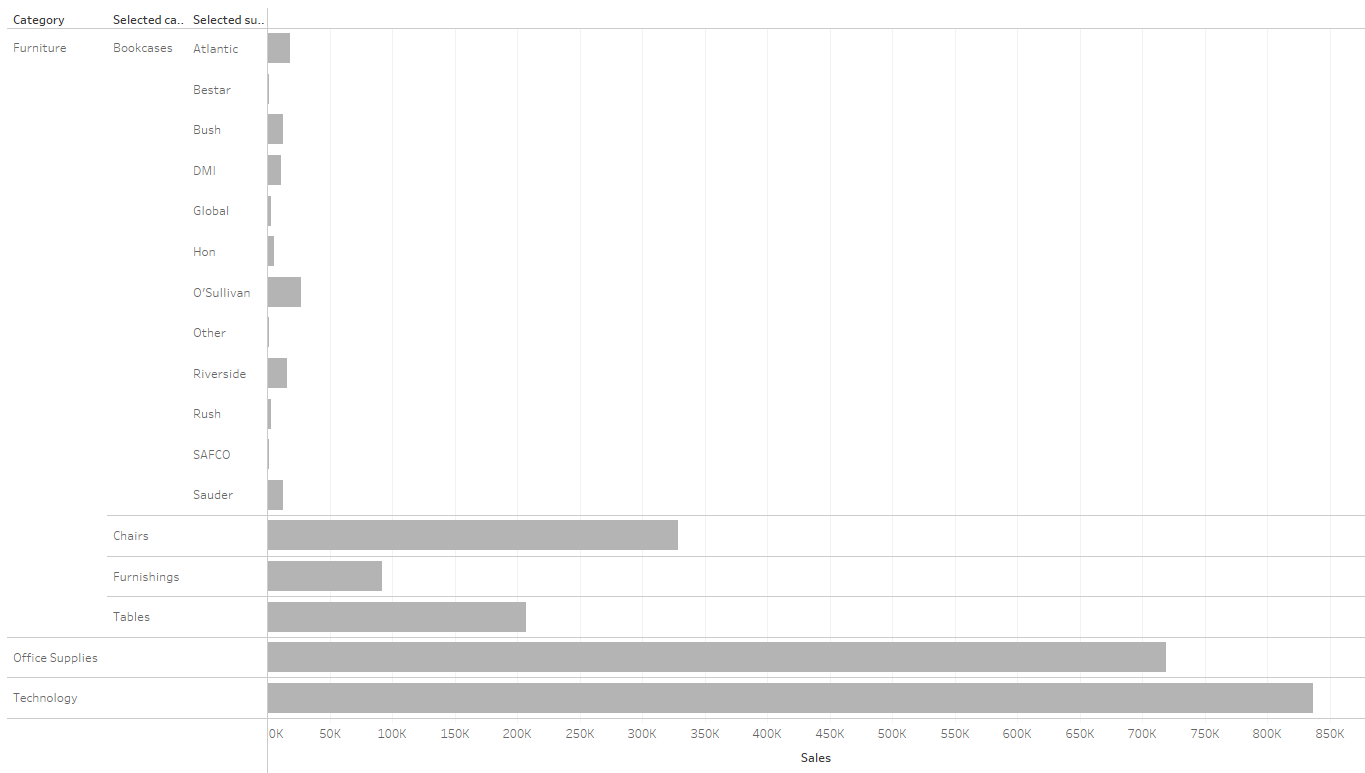
The purpose of this blog is to show how to make a double drill down bar chart. I will use the usual Superstore dataset. In essence, I would like to be able to click on one of the category bars and see the subcategory bars and then click on one of the sub-category bars and see the merchants in this subcategory. Visually this is the journey I am aiming for:
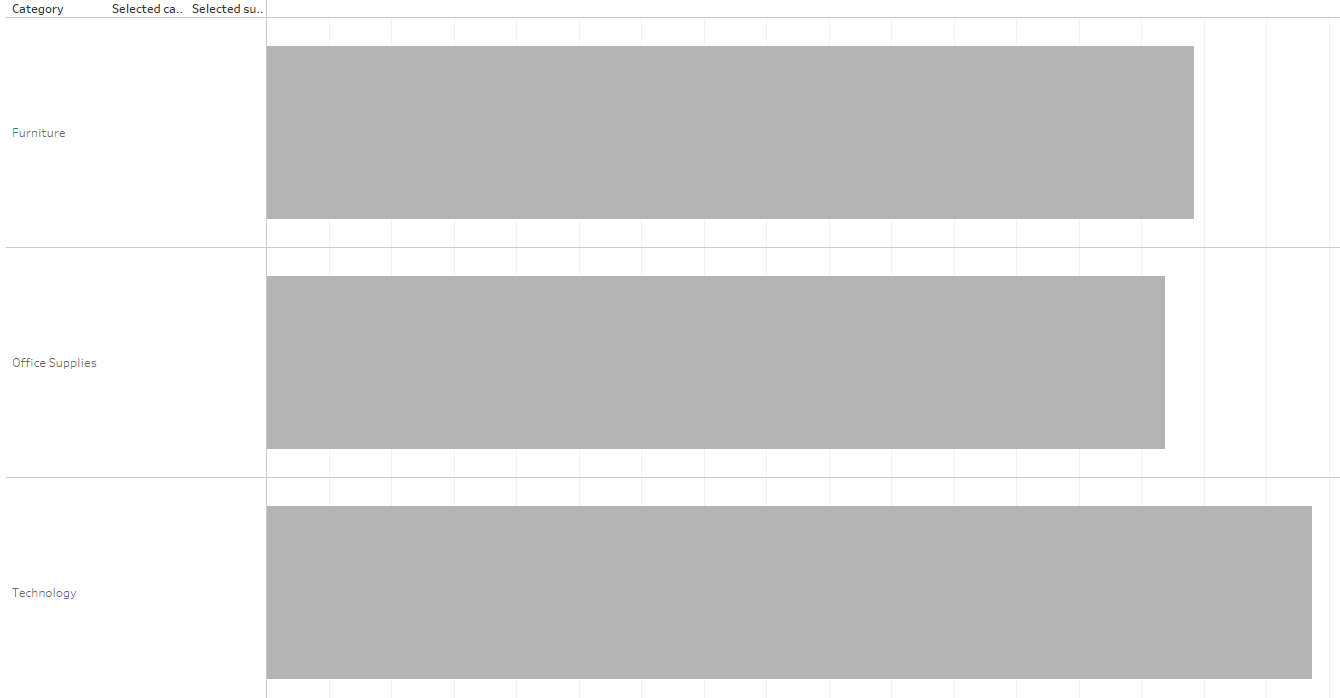
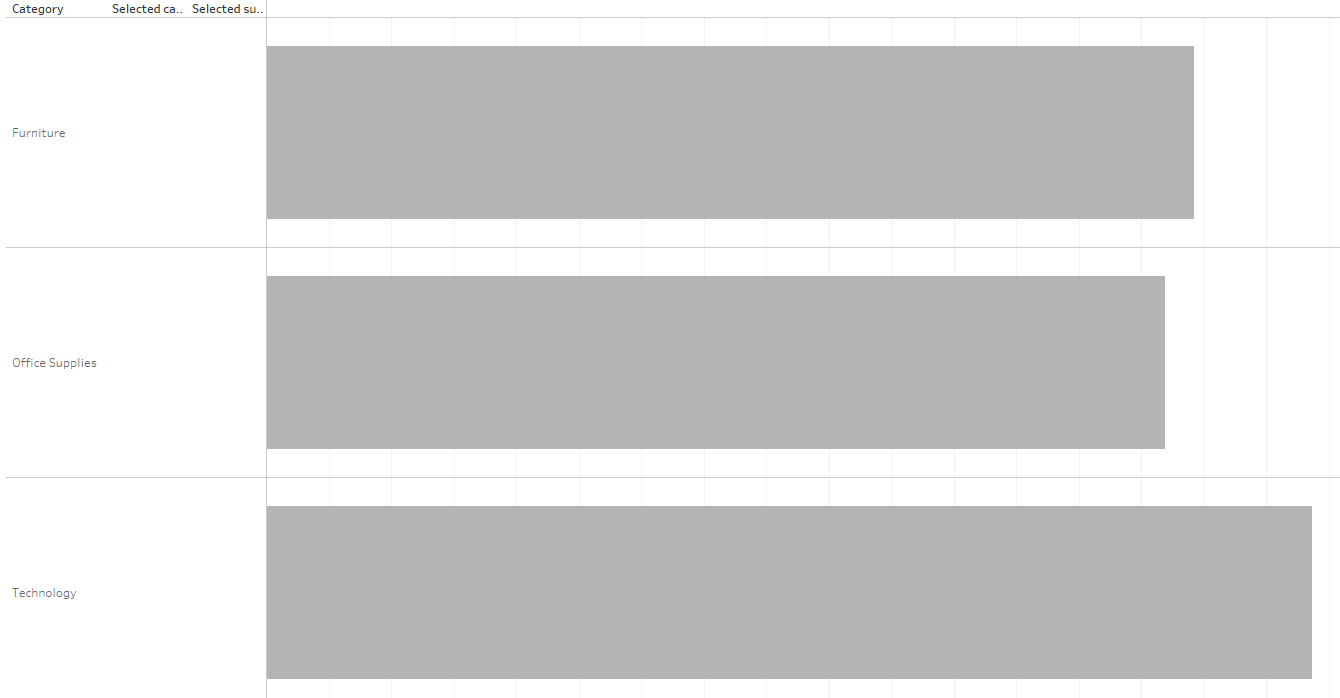
To start with I create a simple bar chart showing the sales per category.
Step 1: Create two parameters.
One for the Categories and one for the Sub-categories and show both of the parameters in the view.
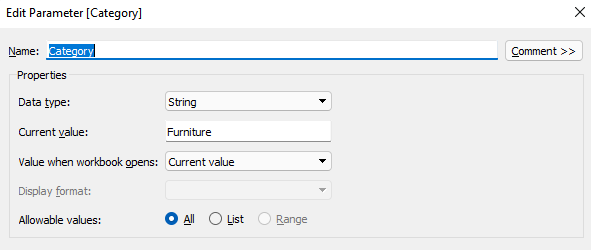
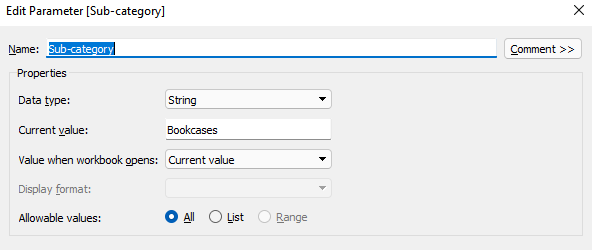
Step 2: Create two calculated fields - one for the category and one for the sub-category and drag them on the rows shelf.
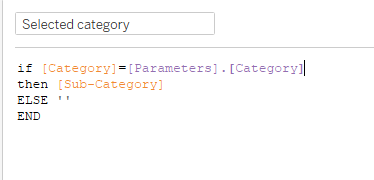
Calculated field for the category:
if [Category]=[Parameters].[Category]
then [Sub-Category]
ELSE ''
END
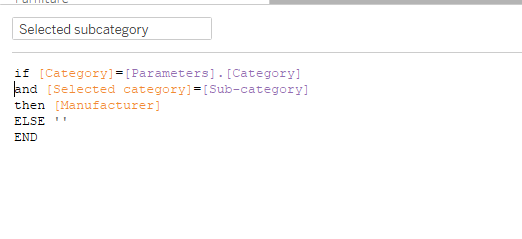
Calculated field for the sub-categories:
if [Category]=[Parameters].[Category] and [Selected category]=[Sub-category]
then [Manufacturer]
ELSE ''
END
Step 3: Create an action for changing the category parameter
Select Worksheet from the top menu and click on Actions. A shortcut for this is Ctrl+Shift+A. Add an action and configure it this way:
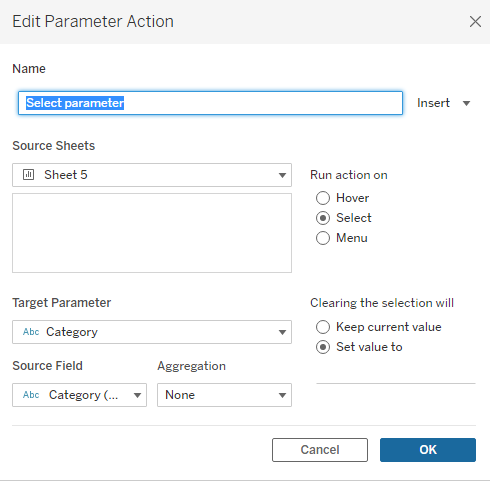
Step 4: Create an action for changing the sub-category parameter.
In the source field in the action configuration I select Selected category.
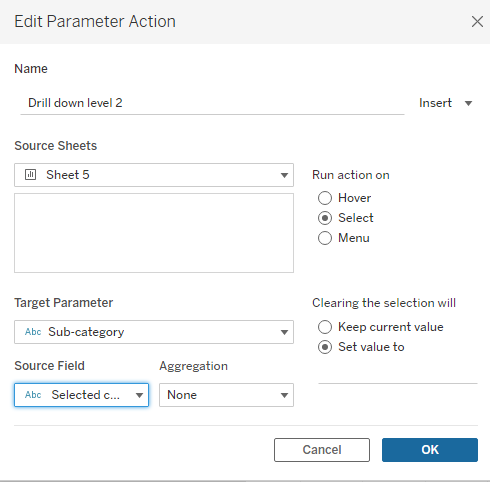
And now we have a fully functioning double-drill bar chart.
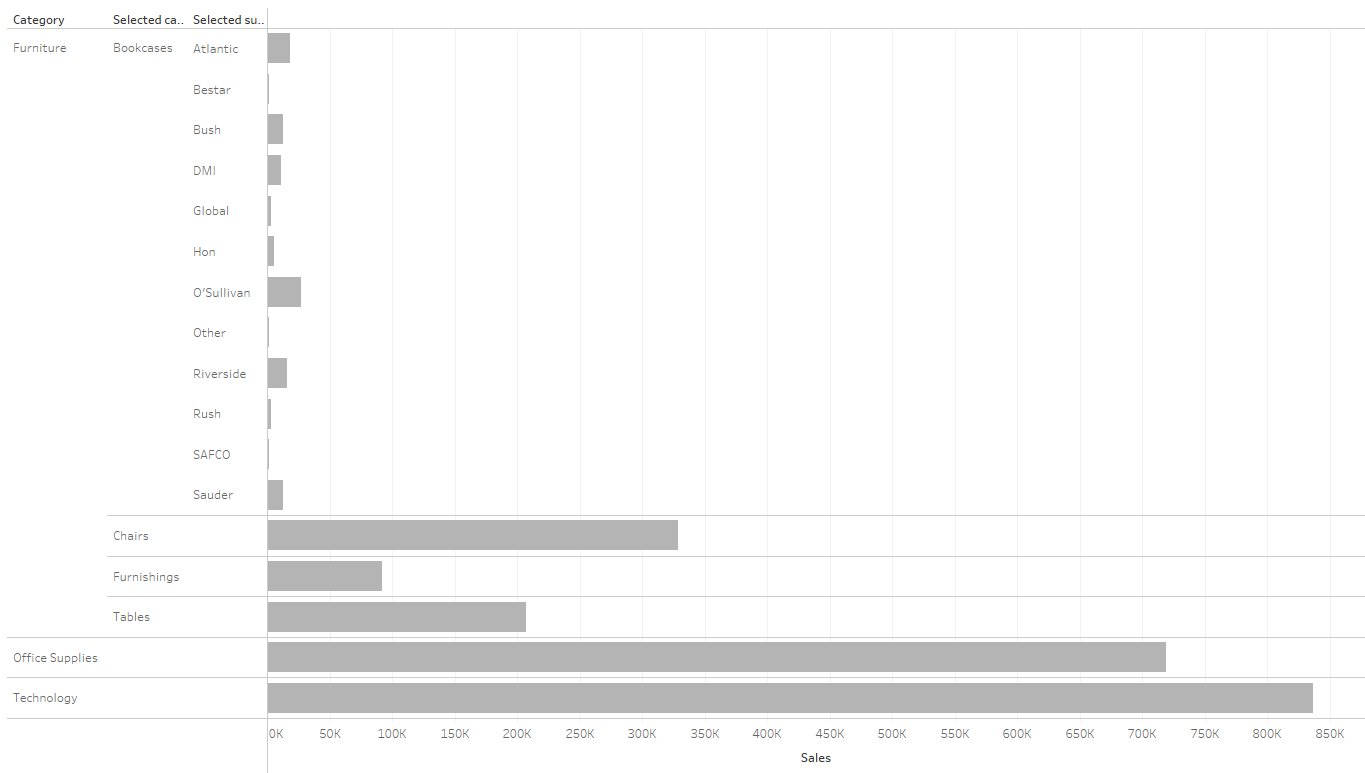
Voila!
