


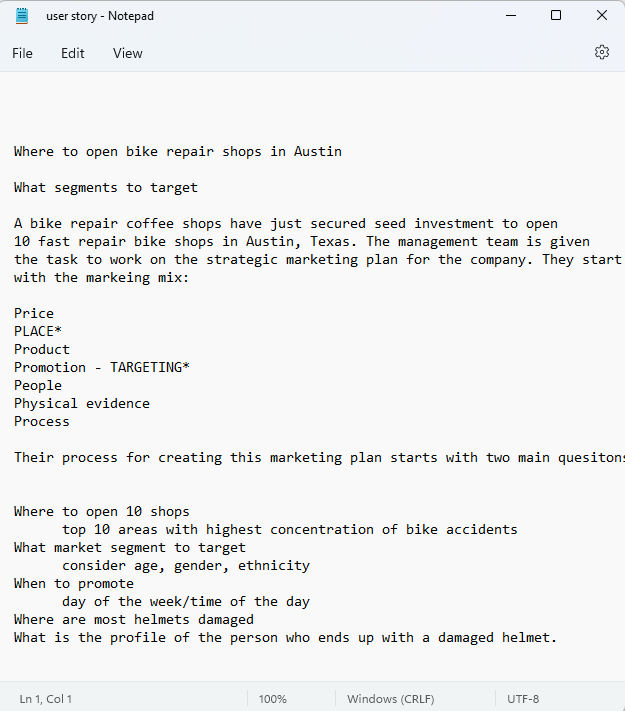
I started with data exploration and creating a user story.
Here are my notes of the user story:
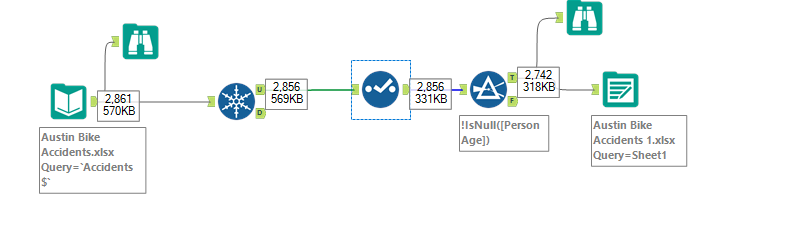
Then I went on to explore the data further. I discovered that there are some entries where the age is null and more importantly, there where duplicates in the data. I went to Alteryx to fix these little issues.
Here is a screen shot of my Alteryx flow:
By 9:30 I was ready with the data exploration and data cleaning part of the task.
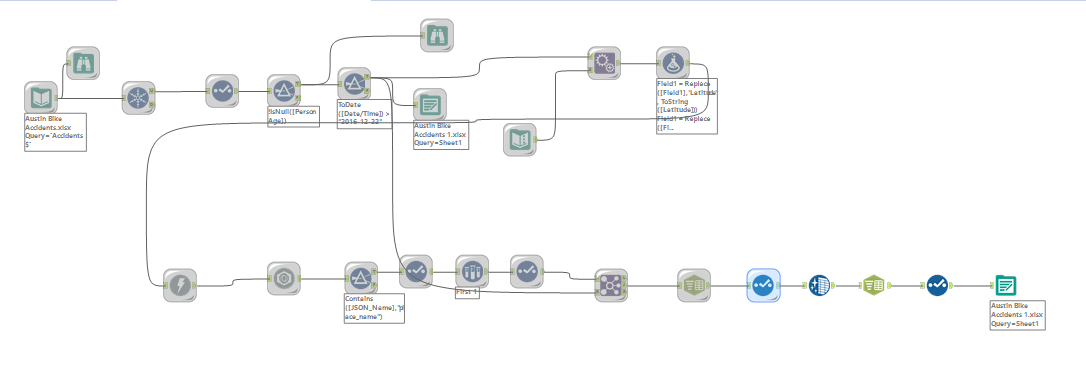
A little bit later I decided to add the postcodes and addresses to the dataset. This took over an hour and the help of a few people. Here is the new workflow:
Next I decided to take a small break from the data and create a logo for my new company. I used a free logo generator from Wix. it took 3 minutes to make. Here is the logo:
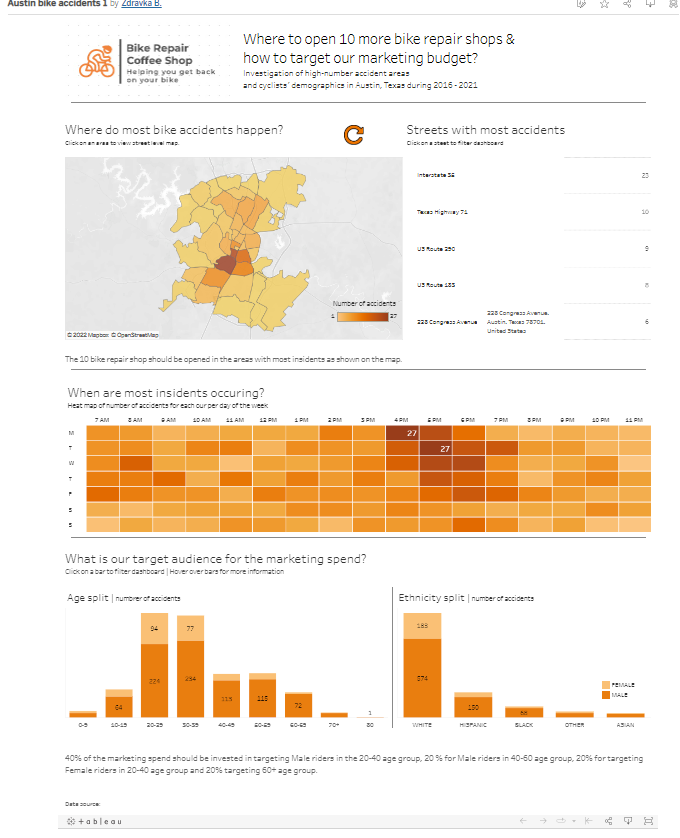
All the time thereafter I dedicated to make a dashboard that was going to answer the questions I set in the begining.
Here is a copy of my final dashboard dashboard.
And this marked the end of the official 4 month training. Now on to more learning in real data analytics life!