


For today's challenge we had to build a Dashboard catering for people with special needs. Glasgow City Council are trying to make their city’s data more accessible to residents, and have given us a sample of road repair data from FixMyStreet to show what we can do.
My day started with a quick data exploration. Luckly there was very little data preparation needed, only splitting a column to get the streets and postcodes on a in separate columns.
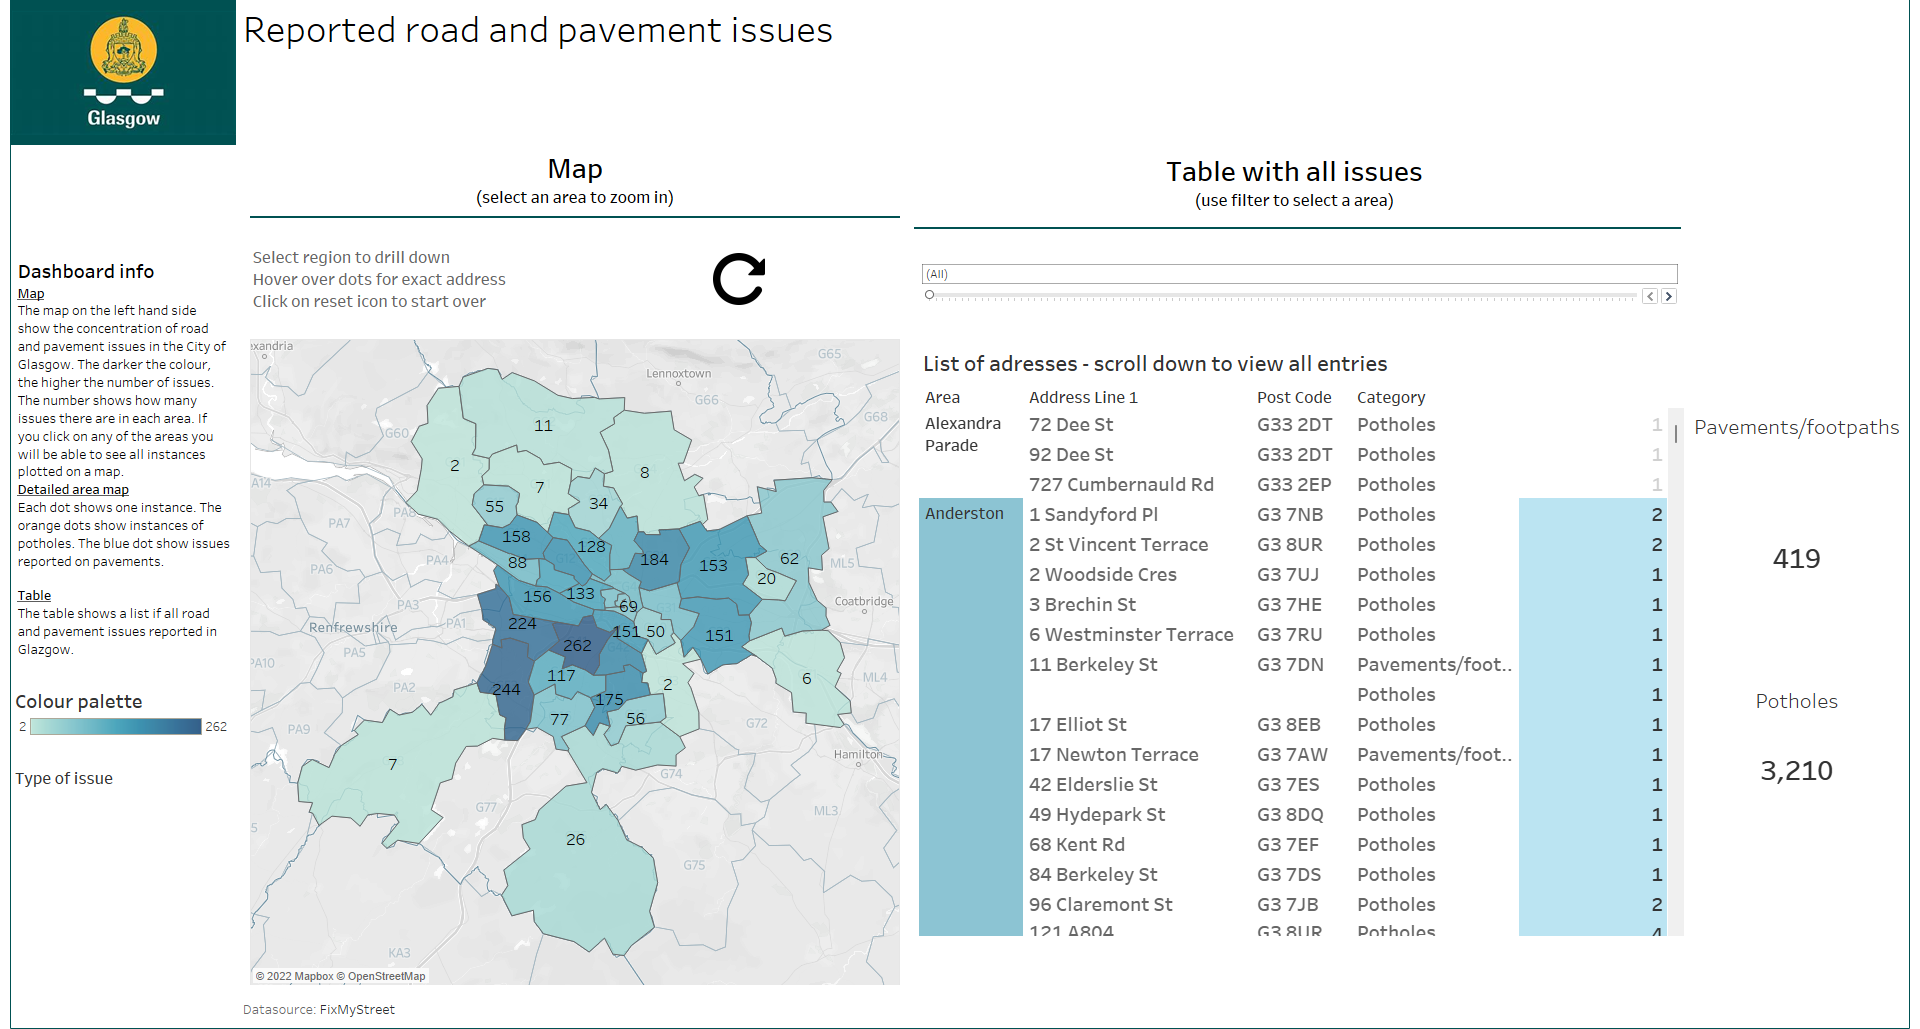
After finishing data prep I focused on the user story and deciding on what questions to ask on behalf the user. I ended up building a dashboard that provided the same information in two different ways to potentially cater for people with dyslexia and people who found it hard to read colour and map and for users who cannot use a mouse.
Here is the dashboard I had at the end of the day:
This dashboard is linked here: https://public.tableau.com/app/profile/zdravka.bratuhtcheva/viz/Glasgow_16565200854460/Glasgow?publish=yes