


How to calculate current period compared to the one before.
This blog will provide step-by-step instructions on how to create Current period vs Previous period KPI.
Step 1 : First I start by creating the needed parameters and calculated fields.
Parameter:
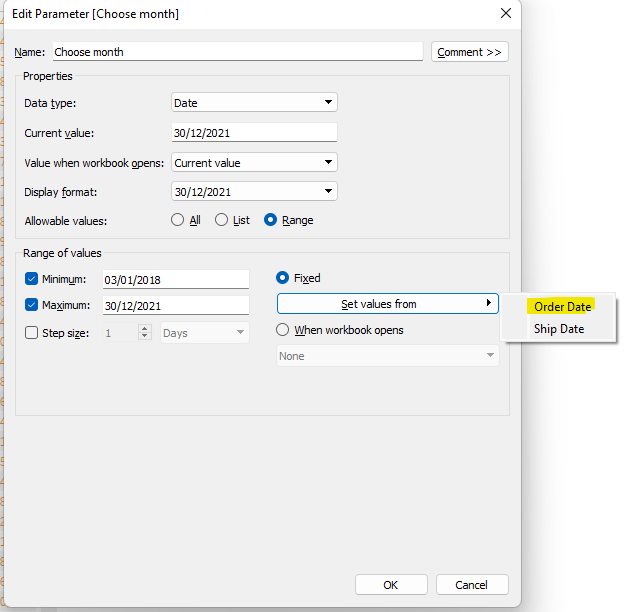
Choose month
Create a parameter for the month we would like to make comparison for:
Calculated fields
Current month
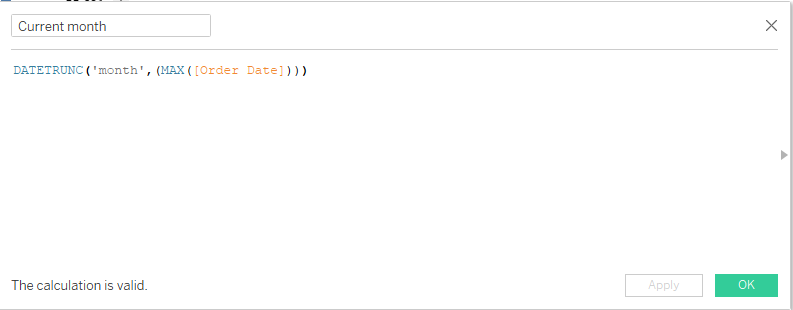
DATETRUNC('month',(MAX([Order Date])))
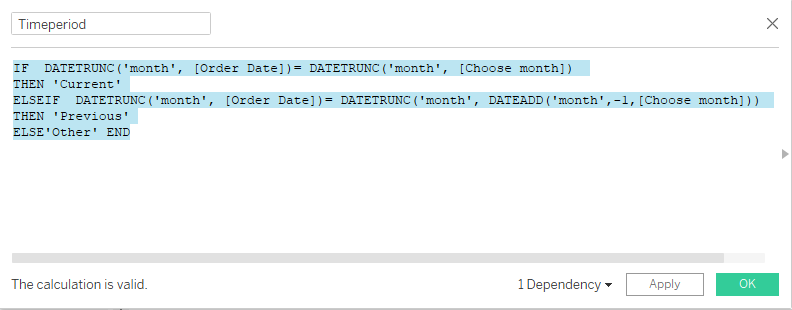
if DATETRUNC('month', [Order Date])= DATETRUNC('month', [Choose month]) then 'Current' ELSEIF DATETRUNC('month', [Order Date])= DATETRUNC('month', DATEADD('month',-1,[Choose month])) then 'Previous' else'Other' END
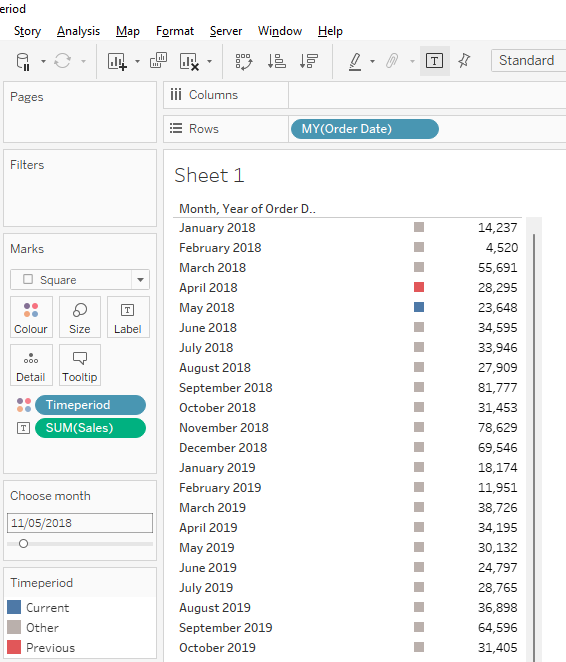
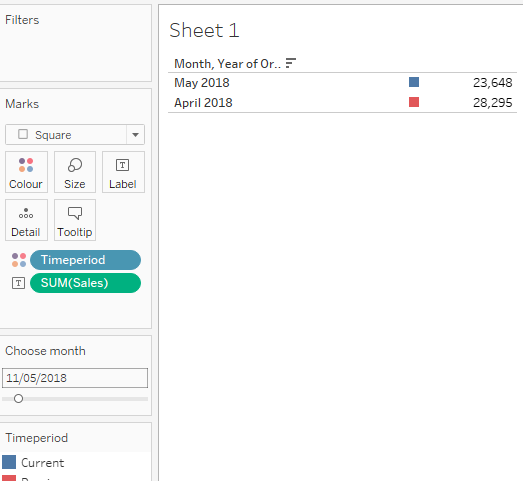
Step 2: I drag Month/Year on the rows shelf and Sales on Text on the Marks card adn Timeperiod onto the Colour shelf. I also show the Choose month filter. We can clearly see that the calculations so far work. We have the Current month in blue, the Previous month in red and all other month in gray.
Step 3: I will now hide all the ‘Other’ values and this leaves me with this month and previous month values only.
Step 4: Drag Timeperiod, Sales and MY(Order Date) on the detail marks.
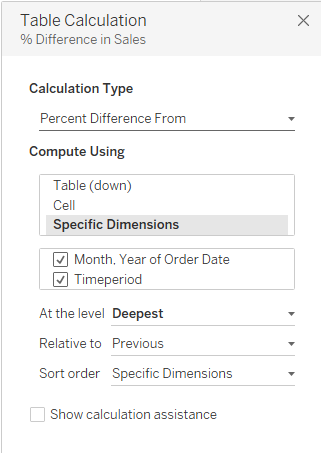
Step 5: Make a table calculation for the sales pill with the following settngs:
Step 6: Change the Sales with the calculated filed from ‘detail’ to ‘text.
Step 7: Change the chart type to text
From here you can format the sheet as needed, hide the fields that are not needed. For this example I have kept only the chosen month.
And here is the result!
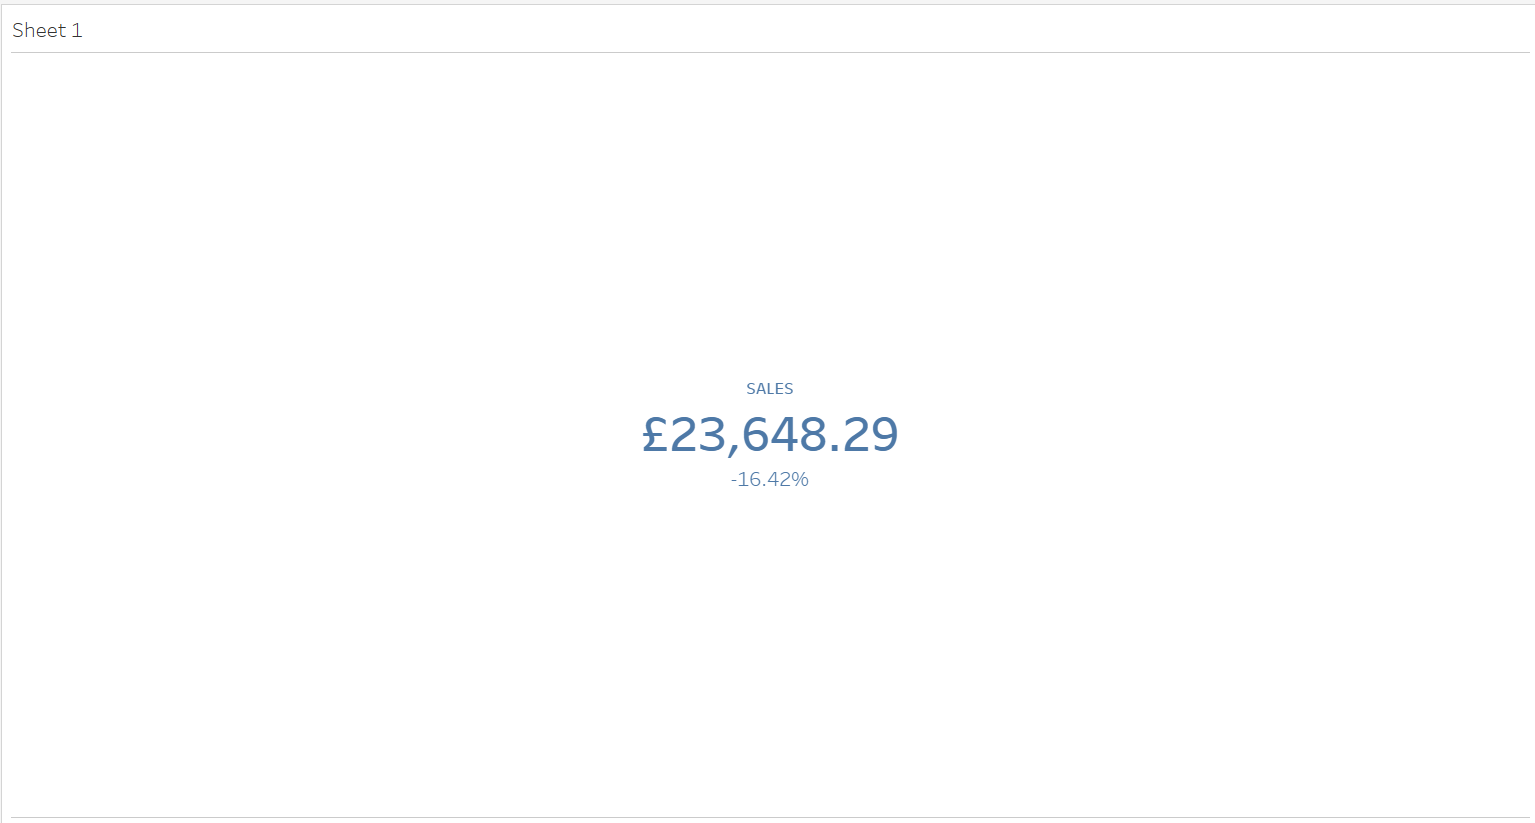
Voila!