


Our workshop today focused on the design elements that enable Data Analysts to visualise and effectively communicate their analysis. Considering these design components as you build your dashboard will assist you in landing your message and enhancing your storytelling.
Data visualisation is the mid-point between sense-making (data analysis) and communication. Data visualisations help us to see patterns, trends and exceptions more easily. We naturally have an ability to interpret information, termed Pre-attentive Processing; it is our subconscious accumulation of information from an environment. Our brains filter and process what is important, and by knowing this, we can use this to our advantage when building our visualisations!
Best practice guidelines for communicating data effectively
Through our session we worked through multiple charts to assess what works well, what does not work well, and how we would adjust the graph for greater effect.
Tip - drawing an output before you start creating anything in your BI tool is particularly useful, whether you are working on a personal project or with a client to feedback to.
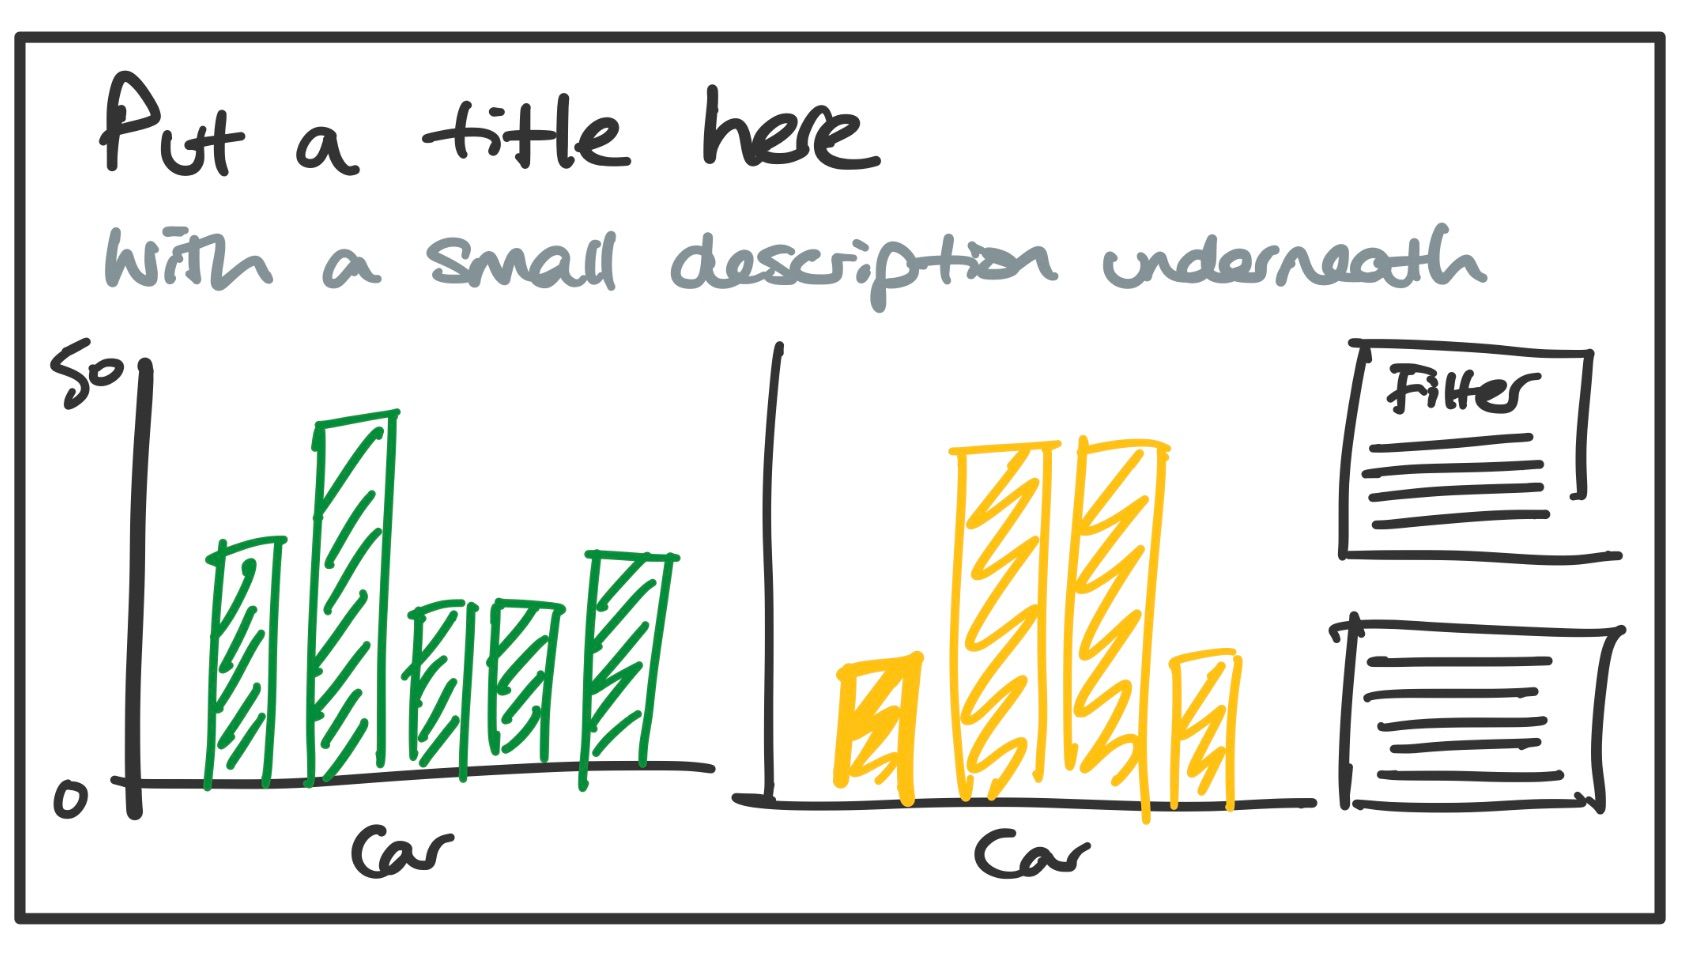
When building our dashboards we should also consider Gestalt Principles of Visual Perception; these principle identify attributes within our visualisation that incline people to group objects in a particular way. This can be through the use of shapes, clusters, proximities, size, orientation or similarity. Colour is another key consideration too. Specific colours can represent particular trends, for example green and red are typically positive and negative, like profits and losses. Colour can be used to evoke emotion and make your work more memorable too.
Colour is a powerful tool as it can be used to achieve greater influence which supports the ultimate goal of utilising Data Analytics, which is to inform decision making.
Colours may be attributed to the particular topic you are talking about; yellow when representing data on bees, green and brown for woodlands, or company colour palettes that may define particular outcomes. Another importance of colour is considering those with any colour blindness; this has the potential to derail the user experience, so using tools such as Spectrum to make your colours more appropriate could be a secret weapon.
Tools including Tableau and PowerBI offer great control over the formatting of your visualisations across individual charts and wider dashboards. Best practice would suggest removing components like gridlines, boarders or divider lines – where appropriate. Achieving a clean visualisation where a user can take knowledge away within 5 seconds of seeing it is the goal. Remove unnecessary noise by adjusting your axis, the size of text, and the use of wacky fonts. By simplifying your visualisation and dashboard, you can utilise these components to enhance how the user reads or interacts with the information – for example, making a key word bold to emphasise important parts. If you have created an explanatory dashboard, you could add labels or annotations to guide the user to key insights you have uncovered.
A great place to practice your visualisation skills is with Makeover Monday – taking a dataset or current visualisation, and adjusting it to present the question/answer in a new way. You can see other peoples contributions and learn from many other Tableau users via Tableau Public too!