


Day 2's Dashboard Week task was to download, process, prepare and visualise data from the website IMDb. The original files were .gz (gzipped) format so my first step started with downloading the data and then unzipping the files using 7-Zip File Manager. The output of the file was .TSV (Tab Separated Value), and each file, regardless of the original file name, exported as data.tsv. Second step, rename each output correctly as you export it from 7-Zip. I ensured this file type was Tableau Prep friendly by importing one copy into Tableau Prep, before proceeding to import all 7 files and adding a Clean Step in to view my data. The size of the data meant the processing took some time and I had to deal with samples of data as I looked through each data source. A problem that I will come to later on.
My next goal was to build out my data model, in sketch form. Here I wanted to understand what fields and records sat within each data source, what fields could connect to one another, and how many rows I was dealing with to see if there was a natural order to follow when joining data together.
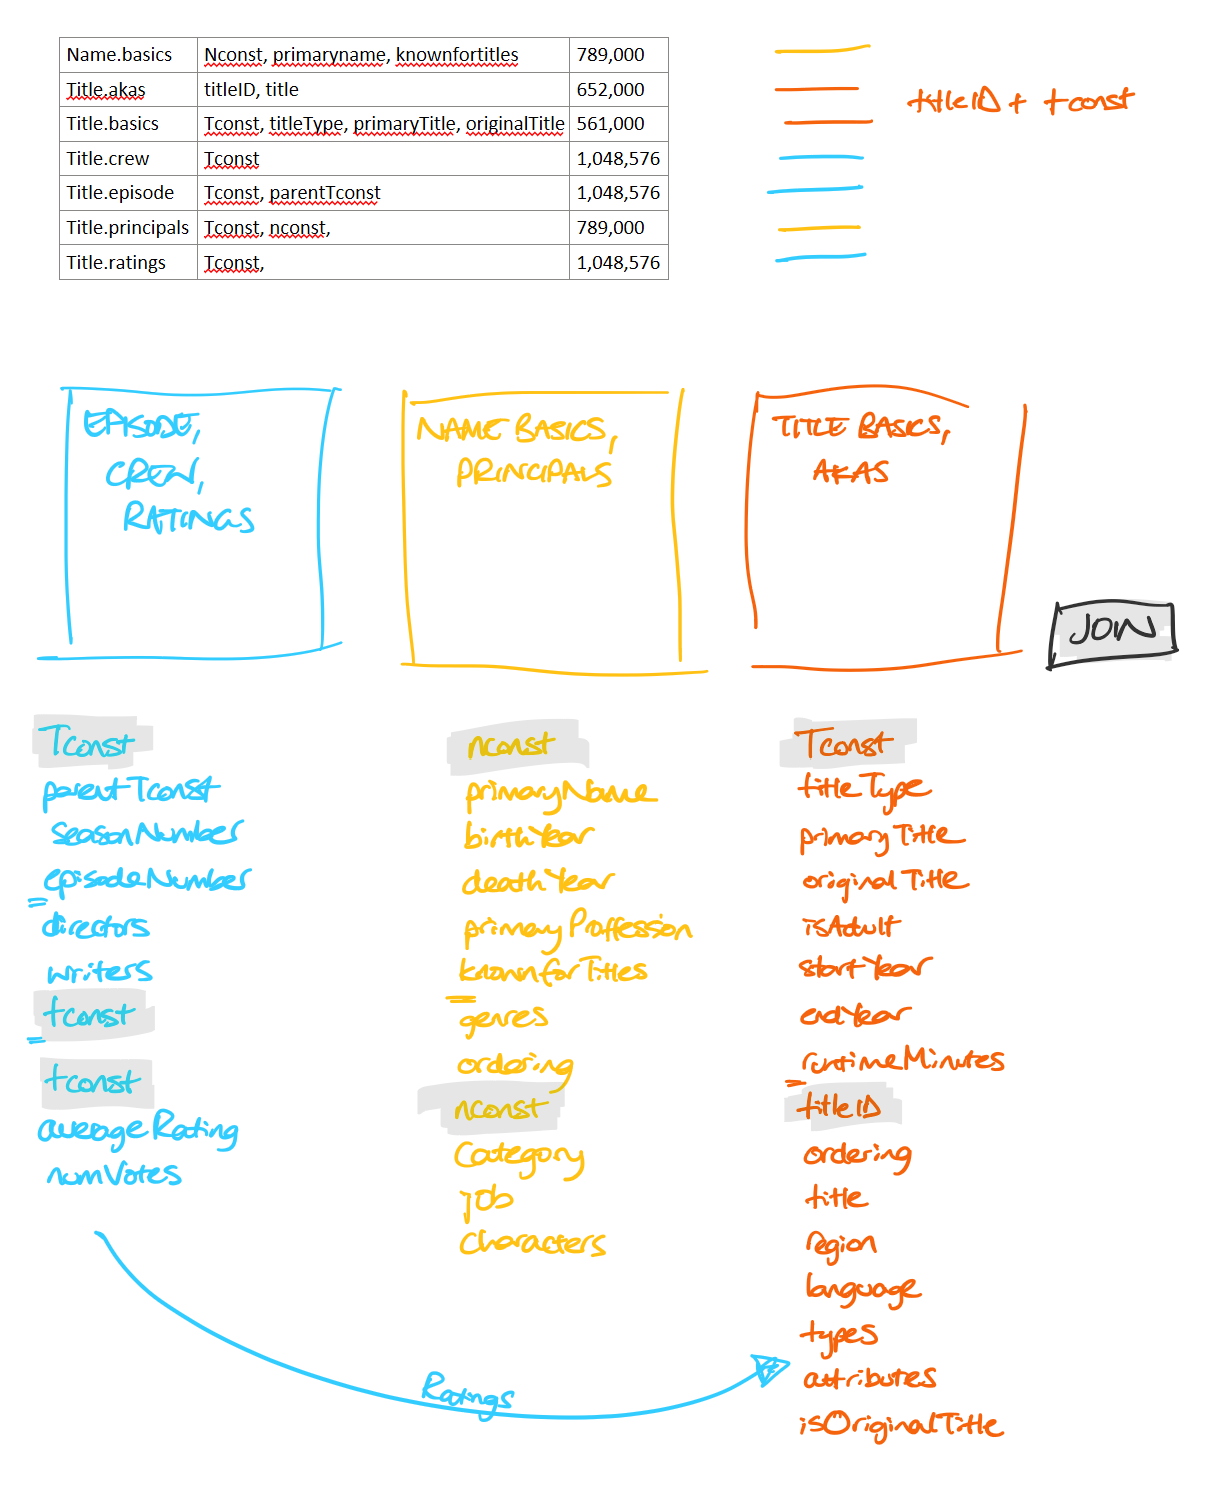
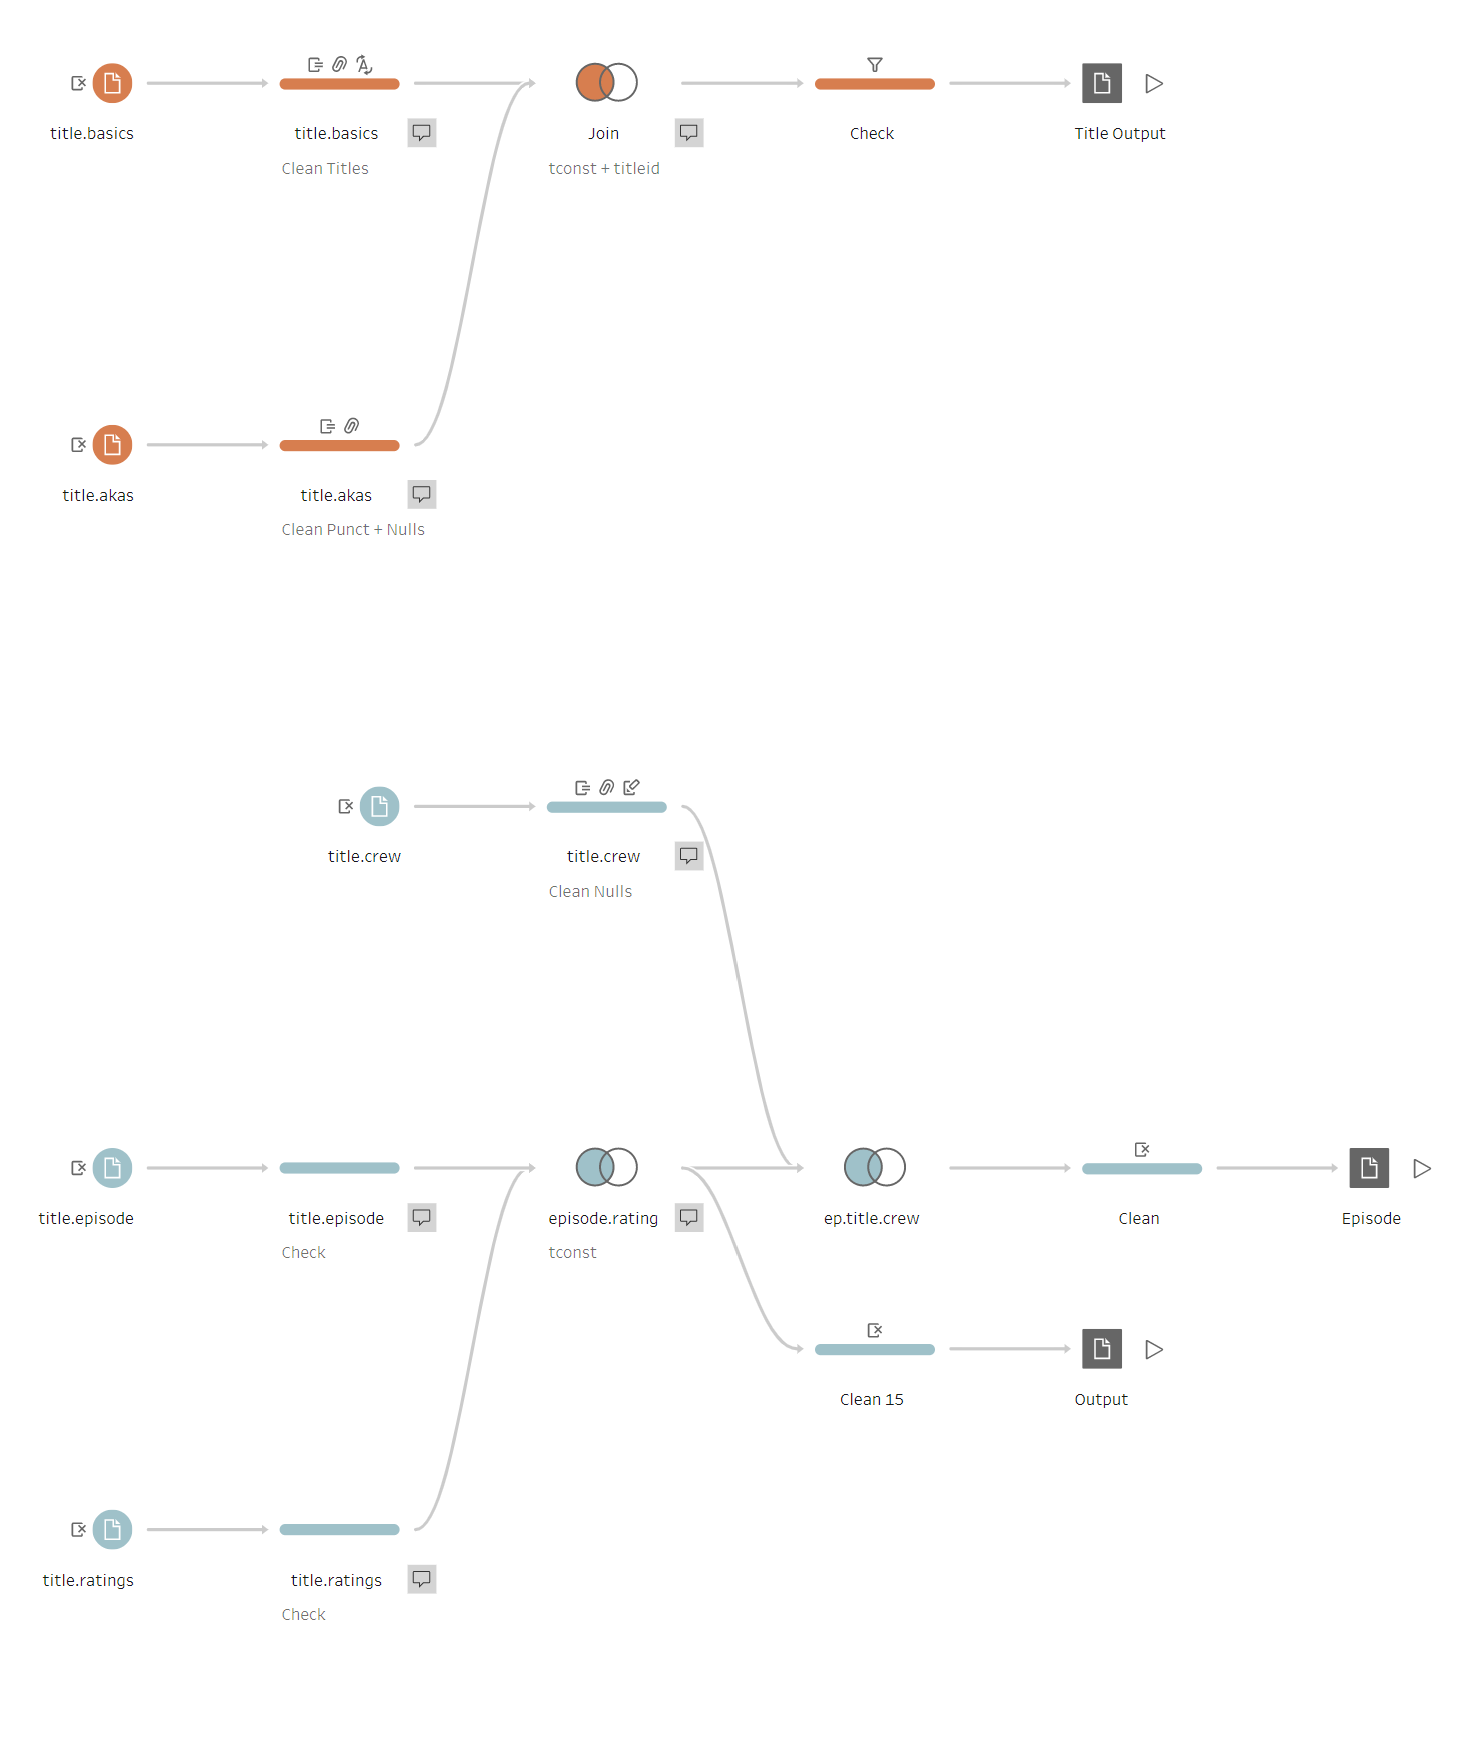
This plan made sense to me and I knew it was one that I could build quite quickly in Tableau Prep. I had a goal of what I wanted my dashboard to be about and its aesthetic, however, at this stage I did not layer this thought process back into my prep flow in order to condense the volume of information. Unfortunately, this became a key flaw in my overall planning as I should have implemented this thought process into my actual Tableau Prep workflow sooner. It would have cut out all of the fields/tables that I did not need for my visualisation. This led to one of the problems I faced whereby a query of the data in Desktop was incredibly time consuming. Another factor, due to the sampling in Tableau Prep, meant I could not see all the movies that I wanted when building my workflow. Instead of pushing the filtering aspects to Desktop, I should have filtered out huge chunks of the data in order to manage exactly what I needed. Therefore bringing the smallest amount of neccessary information into Desktop. I lost a lot of time here.
Whilst working through this process, however, I continued to sketch out ideas based on the fields and records I expected to see and needed to present a story in my dashboard. I wrote them down and drew out mini graphs. The graphs represented what I expected to build. I did this so that when I got to Tableau Desktop, I could run without too much thought.
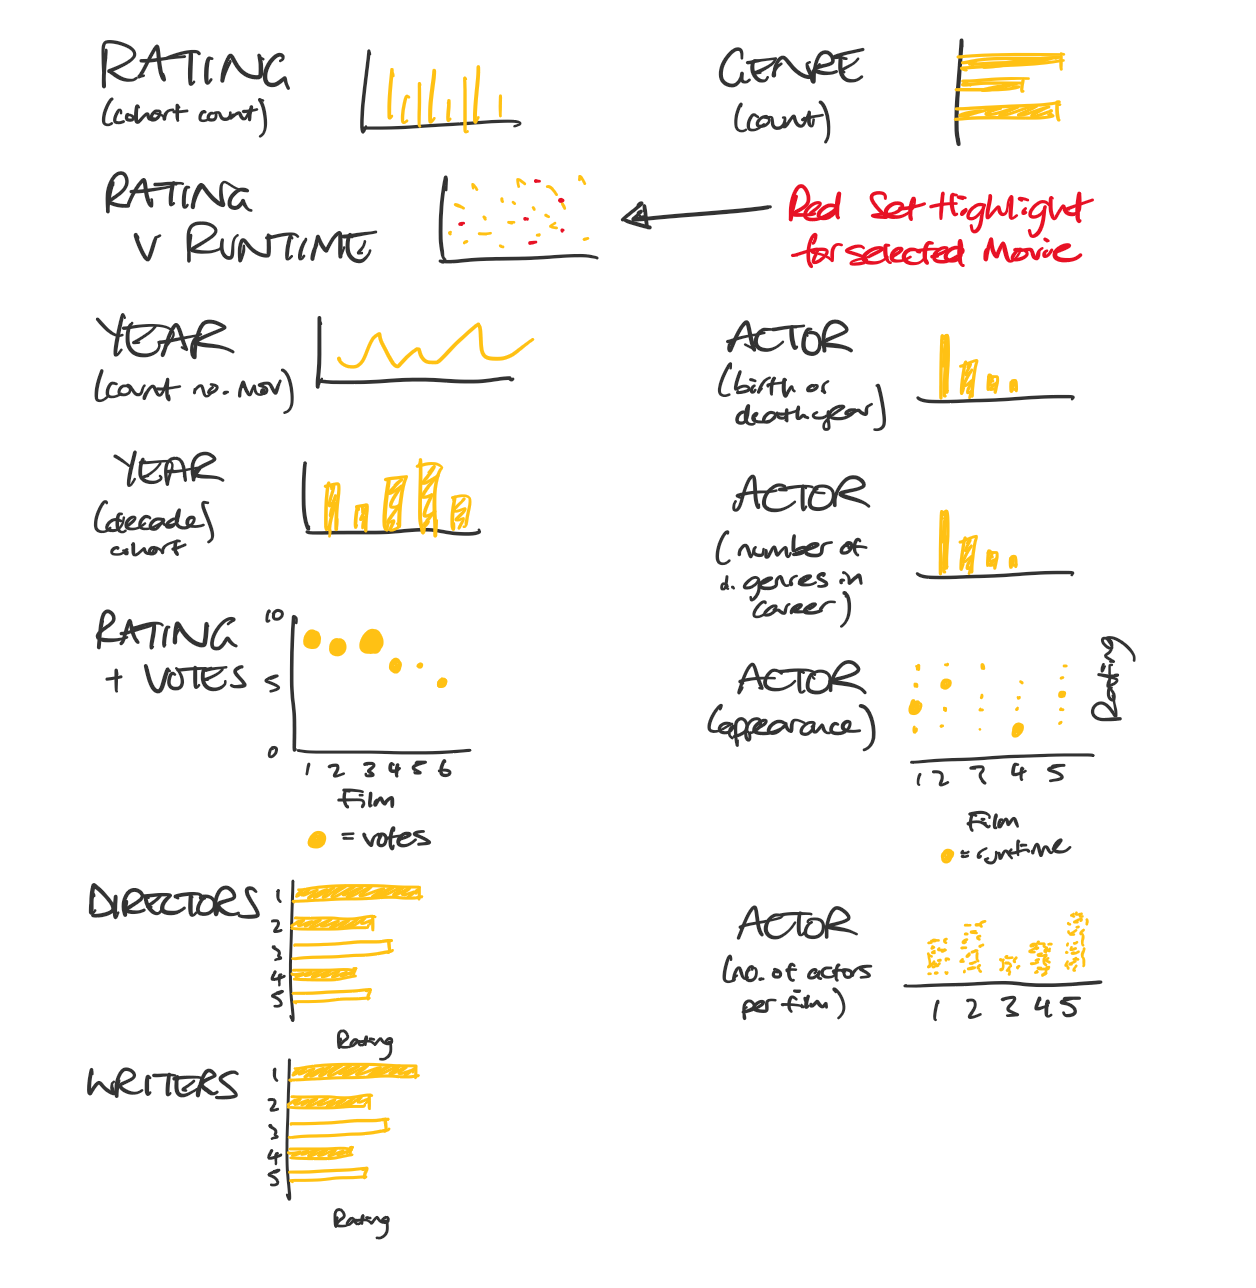
After a lot of back and forth, I ran out of time to present a meaningful dashboard at the end of the day. Fortunately, I had plenty of drawings and thought processes to share. That, coupled with hindsight, has taught me some valuable lessons in relation to handling large datasets. I need to be aware of working in an Agile way, rather than the method of waterfall that I followed; whereby I build a small section, process and then test it to ensure my workflows/desktop is processing - all before growing out more data and more ideas. Lesson learnt.
I will be working on that dashboard over the next week and share the link to that once completed!