On Day 3 we began to navigate our way around Tableau Prep. Tableau Prep is software used to input, clean, pivot and output your data in preparation for your analysis in Tableau Desktop. Its functionality allows you to create a workflow of multiple adjustments along the data preparation journey, to deliver your desired data output, which may vary depending on who is using the information and why.
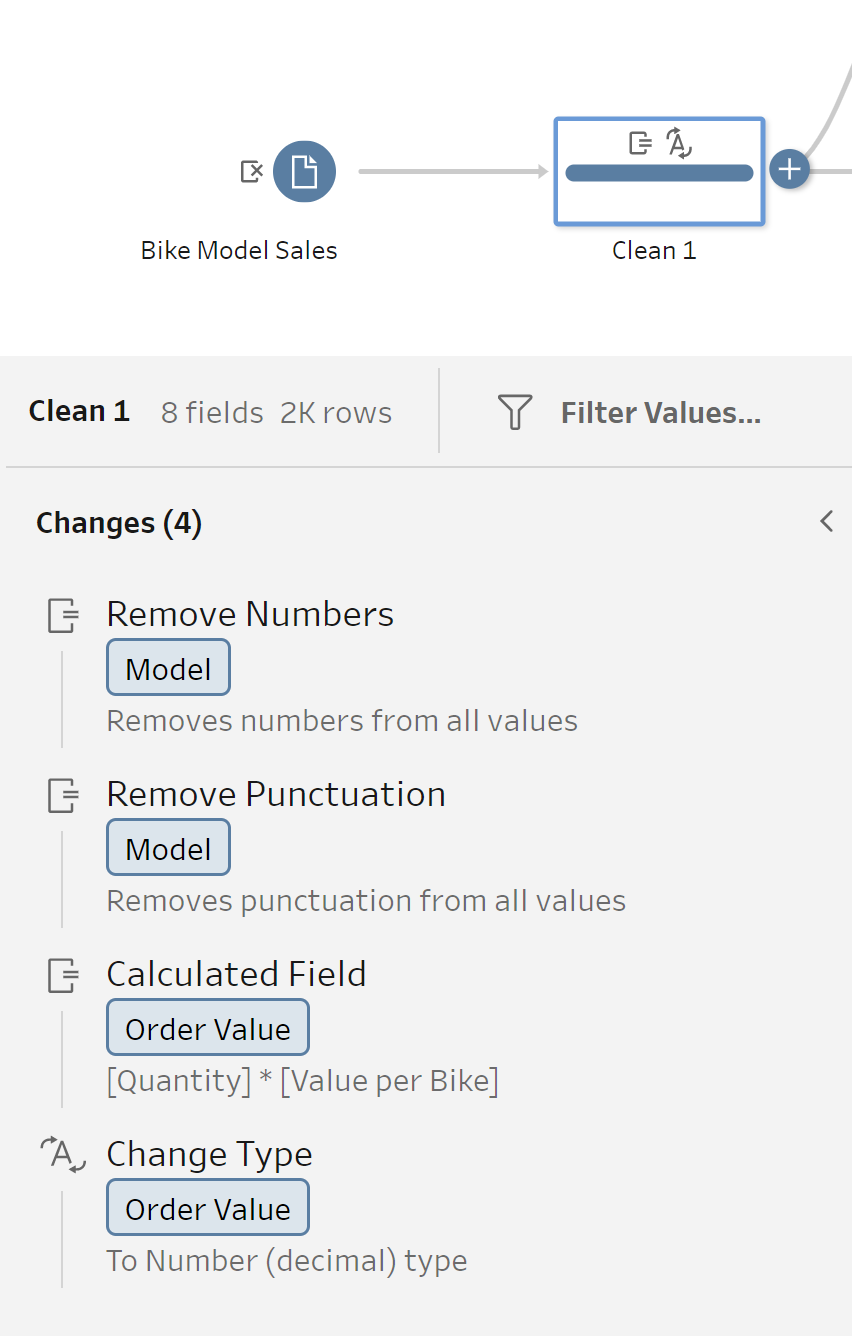
The four key steps for preparing your data are to (1) know your data - what data does is contained in the file/database, what data will answer business questions and how granular is this information; (2) understanding the desired state of this data - this will depend on the question you are answering and ultimately, determine how you work through your data transformation to reach your end goal; (3) logical transitions - it's important to plan the stages of your transitions to highlight key steps and what these amendments may require, for example you may need to remove characters, rename headings or split data. You may want to pivot your data to expand your analysis, by switching records to fields or fields to records, or you may want to aggregate parts of the dataset to find key information that is grouped by specific categories.
Finally, part (4) is to do it - and whilst this may seem obvious, it is a step that may uncover parts of your transformation that requires amendments in order to achieve your desired state of data, so, start your transitions and test that your workflows are functioning correctly as you go.
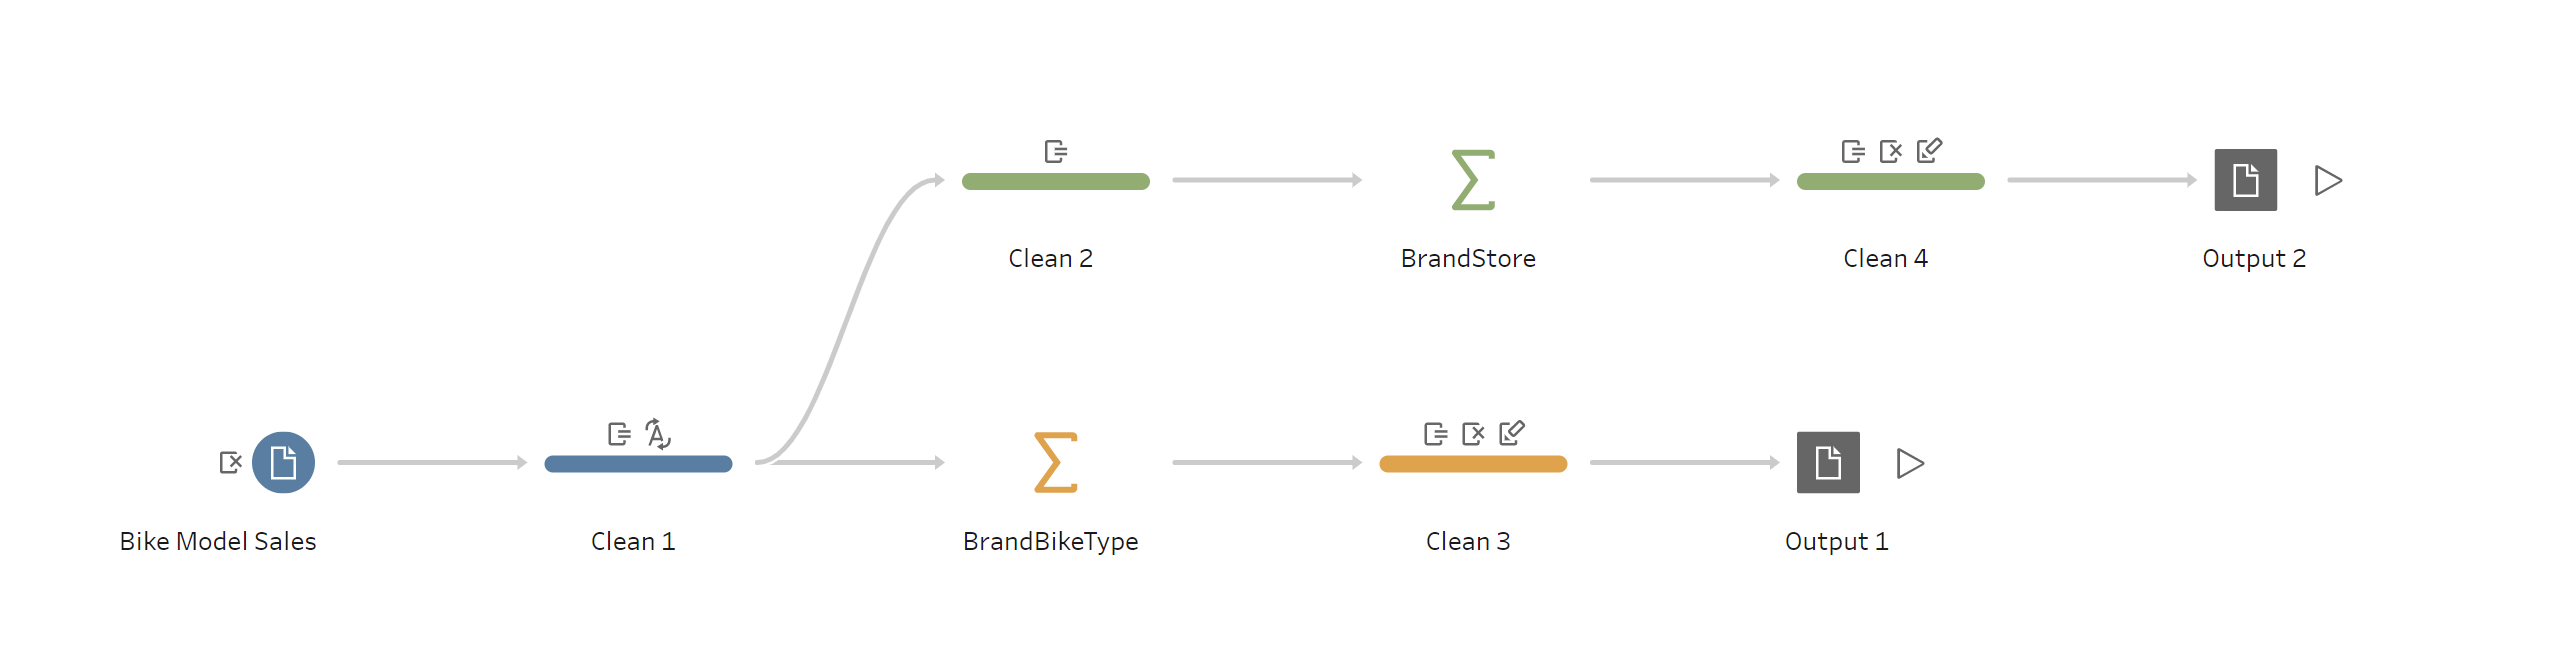
After working through a couple of examples, we took on a Preppindata Challenge on our own (2021, Week 2 - Bike Sales). The goal of this challenge was to output two files, one based on Sales by Brand and Bike Type, the second based on Sales by Brand and Store. Within the Tableau Prep workflow, you create two branches of flows to aggregate data based on the specific data required to answer a question - whether it was focused on sales by store or by bike type. Below you can see an overview of the final workflow. The output is a file setup in the structure and format (hyper, xlsx, csv) required for you to analyse and visualise using Tableau Desktop.