


Being able to change the level of granularity with a parameter to give a different edge to your analysis is one of the big benefits of Tableau. The enhanced user control allows more a more interactive experience and one that I can definitely see myself using in the future.
Here is how we did it.
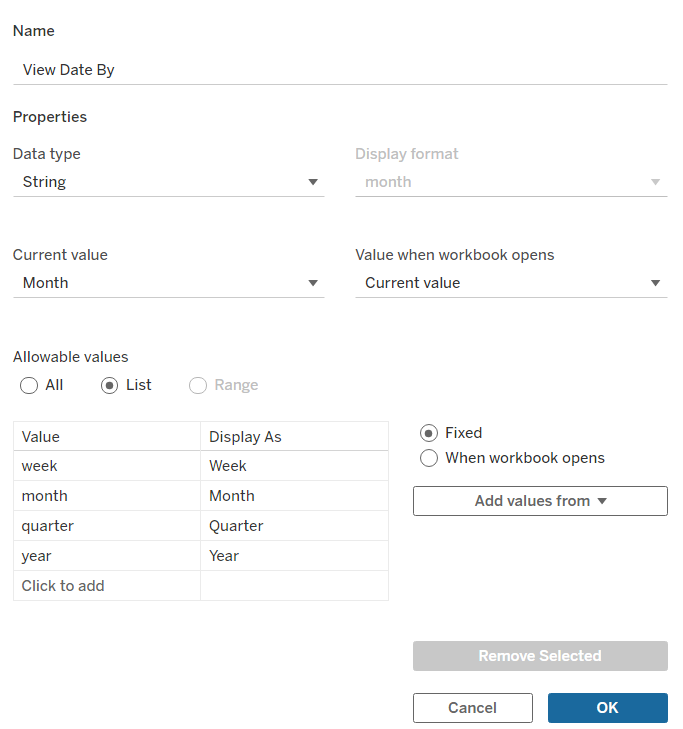
First things first, we made a parameter like in my previous blogs, with the values in the list tab being ones that we'll be able to change the scope of the analysis with. Here we've chosen Week, Month, Quarter and Year.
Next, we've made a calculated field in order to activate the interactivity of that parameter. Here's what it looks like.
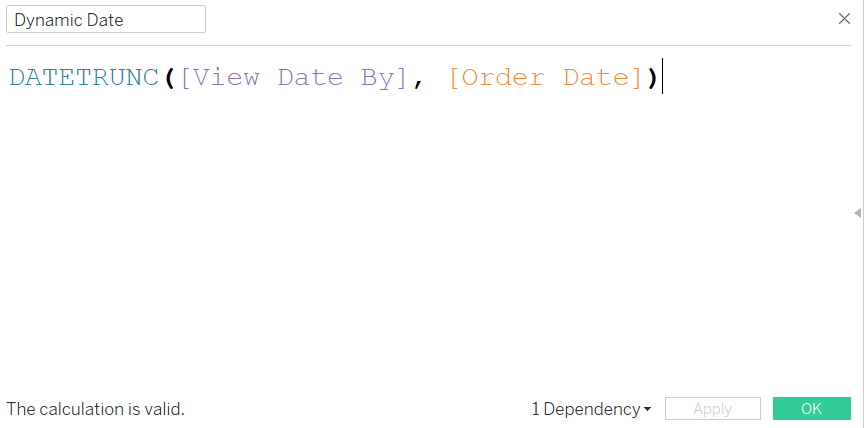
What this formula is doing is it 'truncates' (replaces) the precision of the order date (e.g. Year, Month, Quarter, etc) with the specified level that has been selected in that parameter.
Placing your Dynamic Date calculated field on columns (make sure to right click it and select exact date and continuous!) and sales on rows, as well as making sure your parameter is showing, will yield you the result in the GIF (pronounced like 'gift' but no 't', who actually says it like 'jif'?) above.
I found this use of a parameter really interesting as, alongside providing the user some interactivity with the view, it enables you to change the level of analysis you're using when looking at certain measures.
By writing a blog on it, my hope is that it is eternally engrained in my mind and I'll be able to use it in the future when I'm asked to analyse something on different levels when dates are involved. Doesn't sound too niche of a request to me!