
In the latest version of Tableau Prep (2023.3) there are some new fun features. The one we're going to have a look at is the visual pane which allows you to create a running total calculation.
A running calculation allows you to get the cumulative sum or average of a measure, as well as choosing what partition to work with, do you want to reset the aggregation every year or month or year and month? That's possible.
For our example we're going to use Sample-Superstore and calculate the amount of sales per year and month.
Below is our target output:
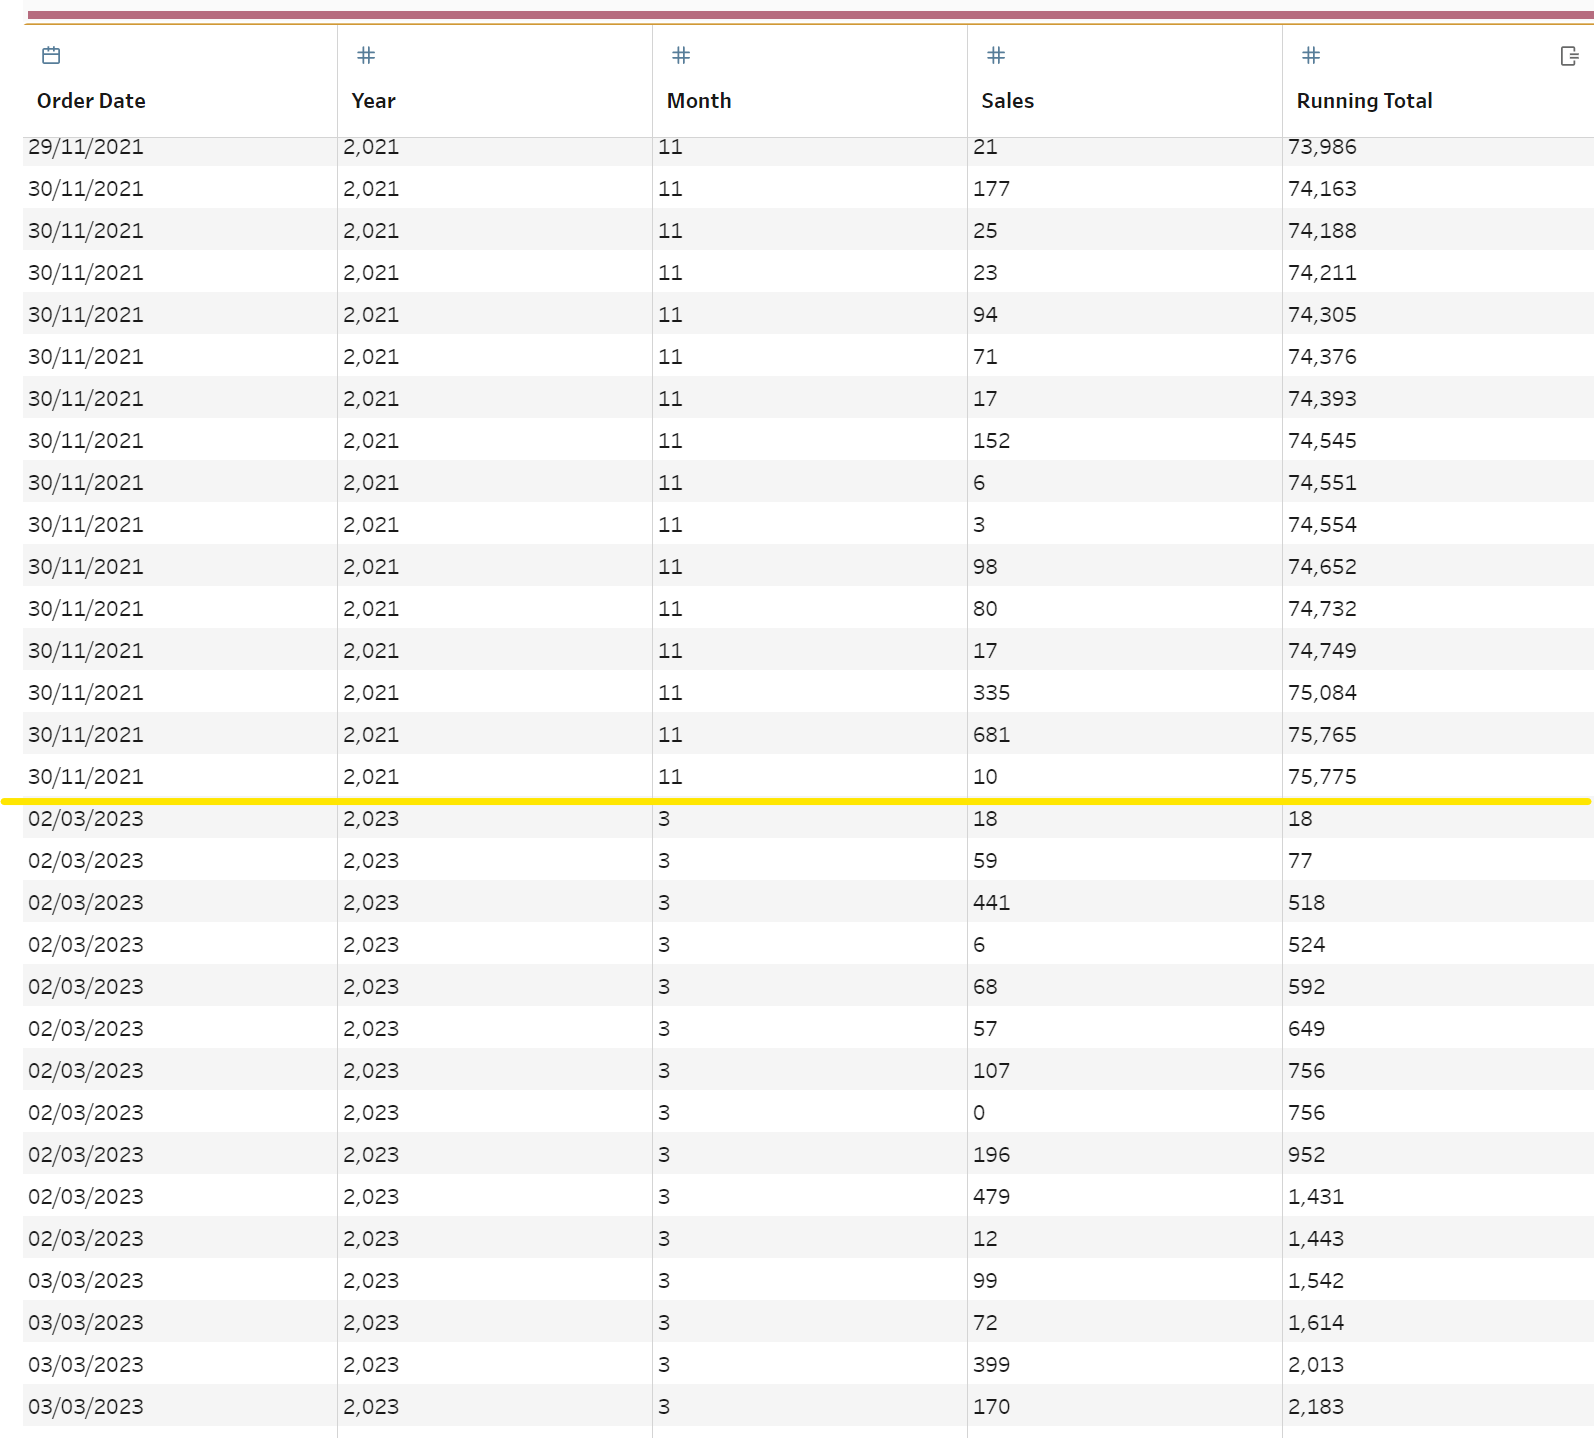
You can see that the count of the "Running Total" Column, which calculates the Sales up to that data point, resets once the month changes and does the same for the year.
To get there we can simply click onto the three dots on any of the columns, go to create calculated field, then to running total like such:
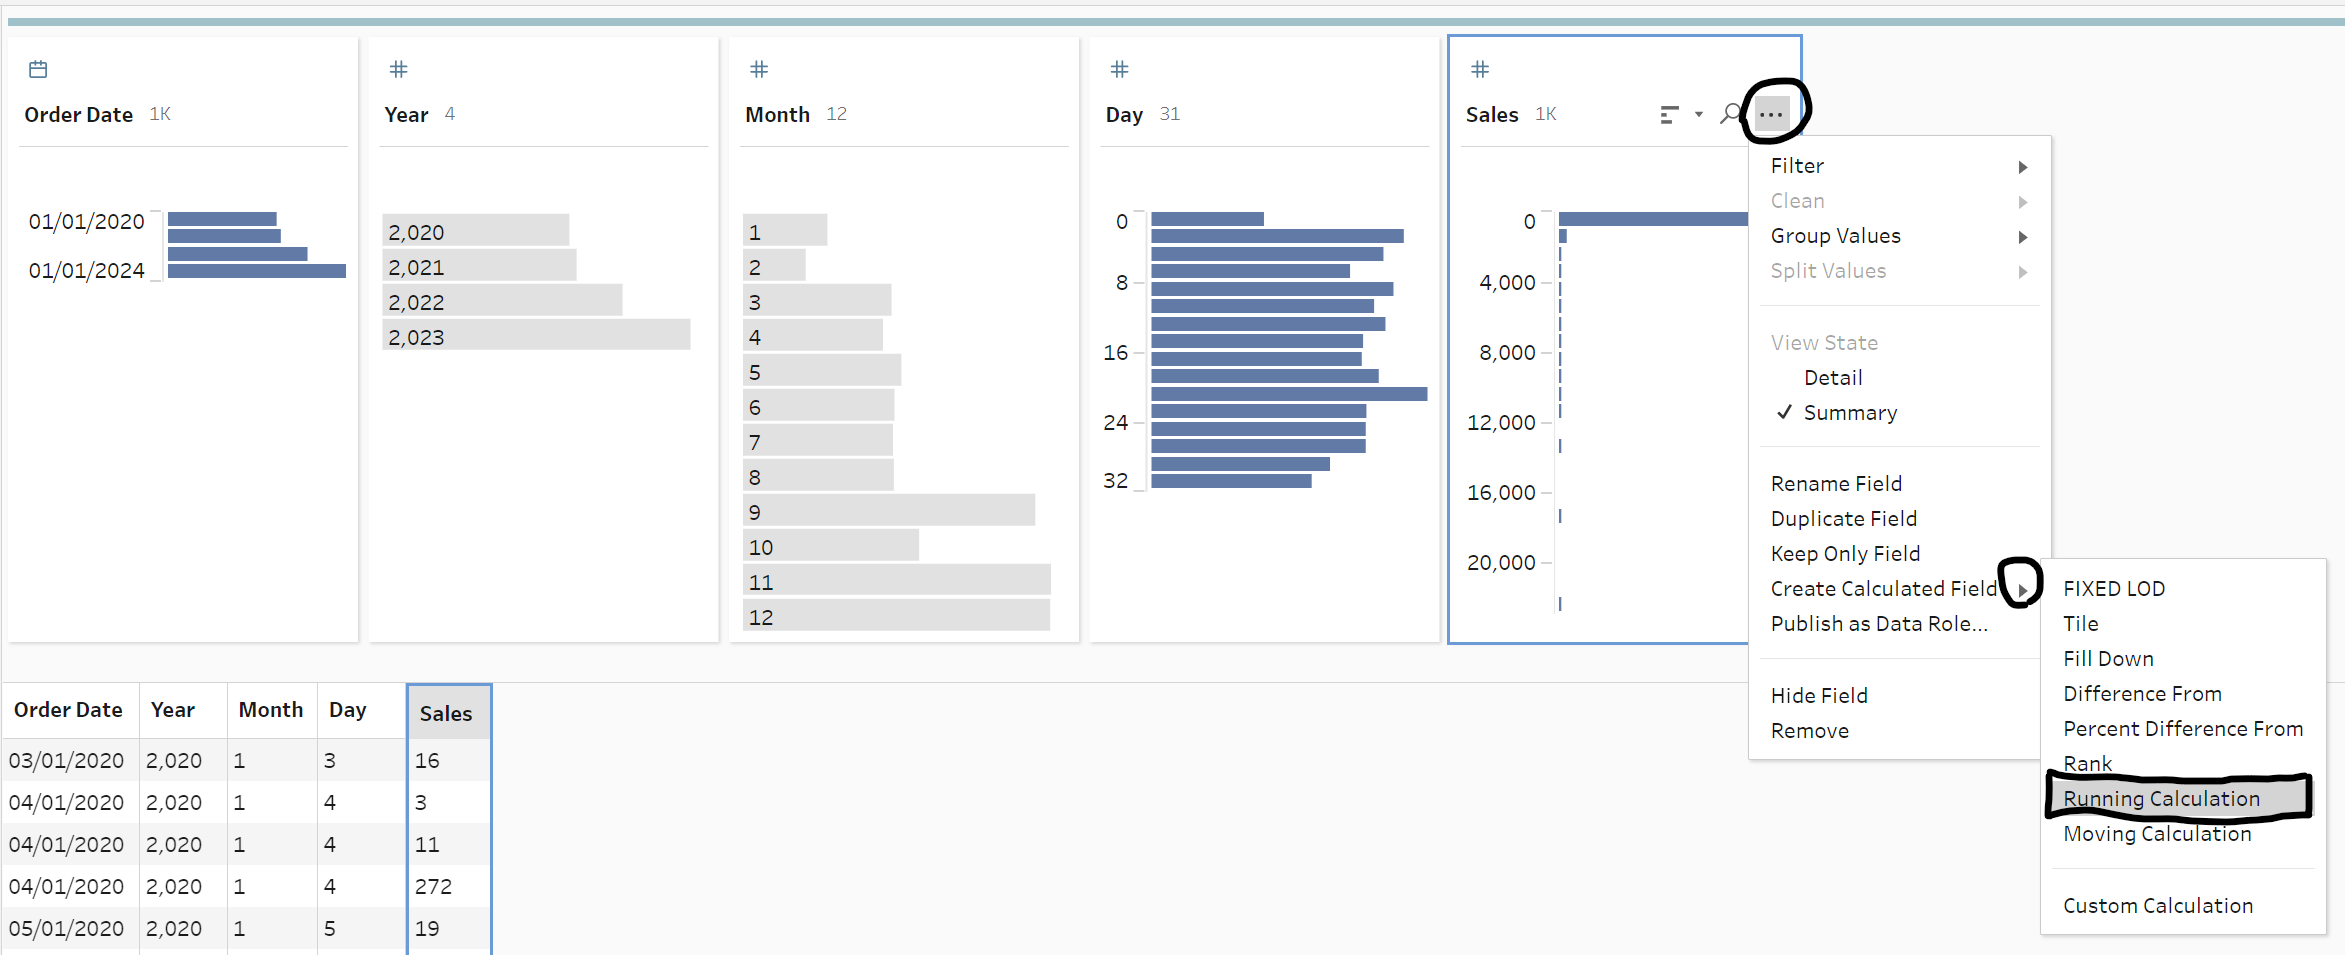
The following tab view should open up:
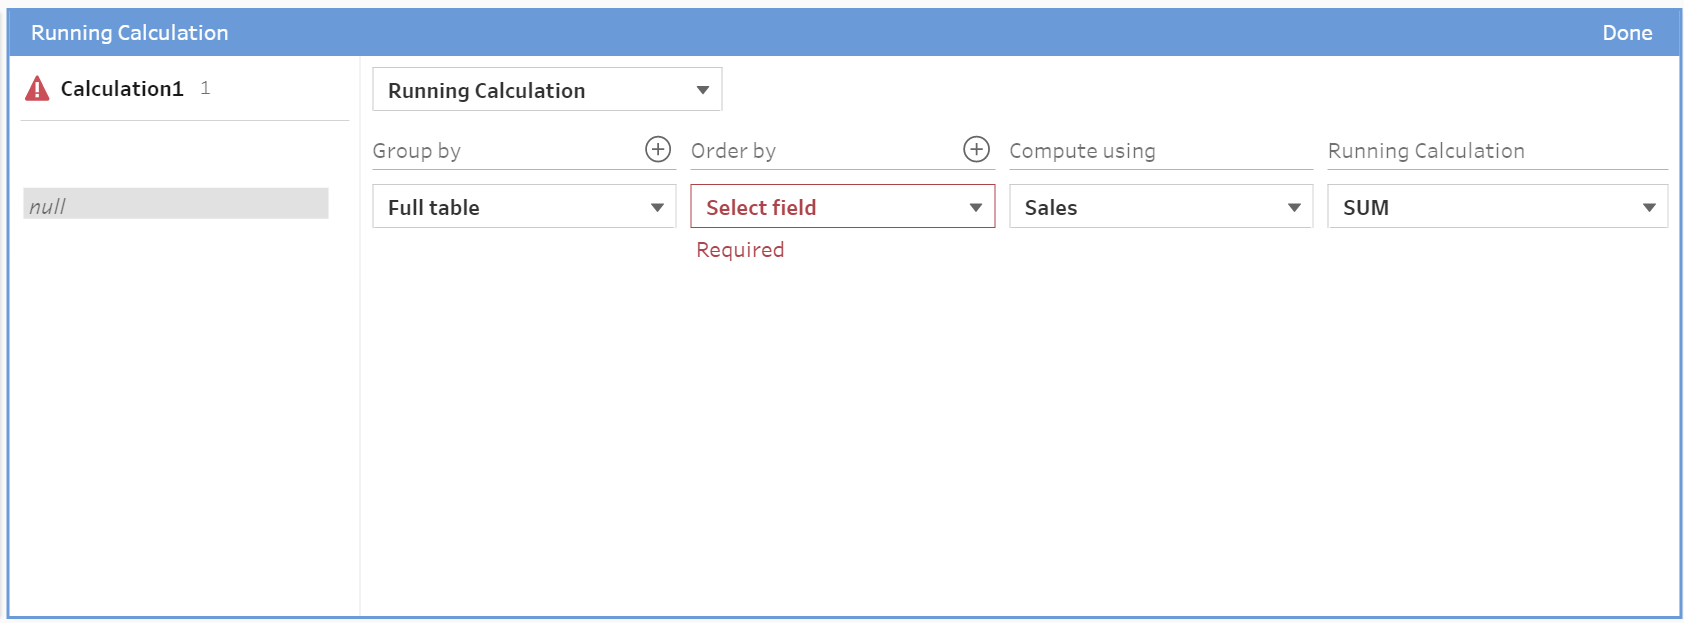
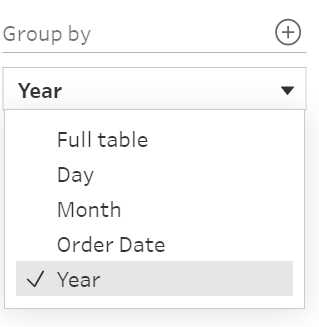
Group By allows you to choose which field(s) the calculation will reset on. We want to pick both Year and Month. Add a second group by clicking the addition symbol in the corner:
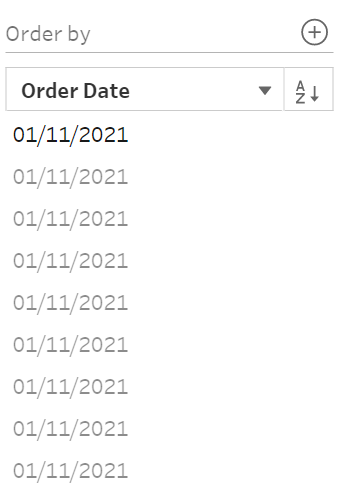
Order By will allow you to choose what is used to based the order of the data set. We've choosen Order Date.
Make sure the measure you want aggregated is chosen in compute using and choose your method of aggregation. In this case both Sales and Sum.
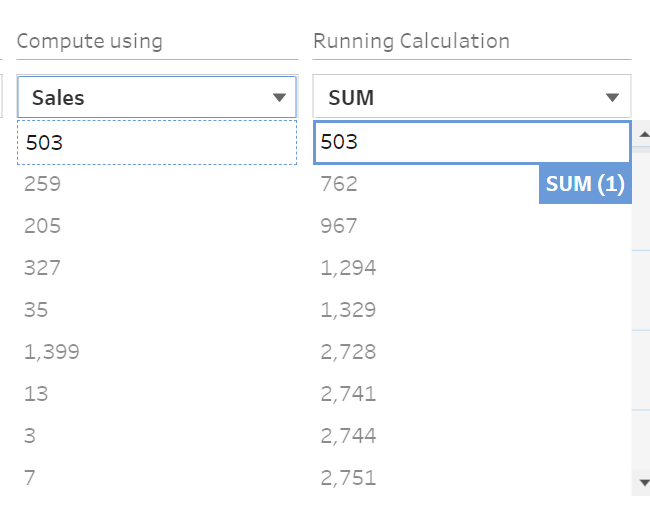
You can now click down and will find that the calculation resets every year and month unique combination.
