


"New Rows" is a quite handy feature in Tableau Prep for filling gaps in sequential data, often used to generate dates. In this post, we will look at a fictitious use case where new rows have to be generated to make the data aggregatable.
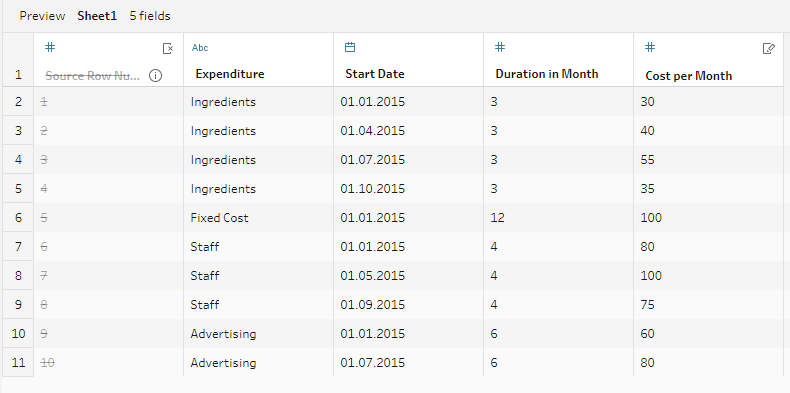
The original table contains different categories of expenses from a fictitious shop. Their amounts change by a monthly based duration of time (except for Fixed Cost). For instance, the cost for Ingredients was 30 per month from January to March, within a three-month period. The goal is to calculate the total cost for each month. For that, we'll need a column containing the cost for each month whenever there were expenses. The data now only includes the start date of each expense category, meaning that we have to fill in the rest of the months where cost emerged.
First, we add the end dates for each row using the following calculation:
DATEADD('month', [Duration in Month], [Start Date]) - 1 (Note that we have to subtract 1 to get the correct date. Also, make sure the new filed is set to type "Date".)
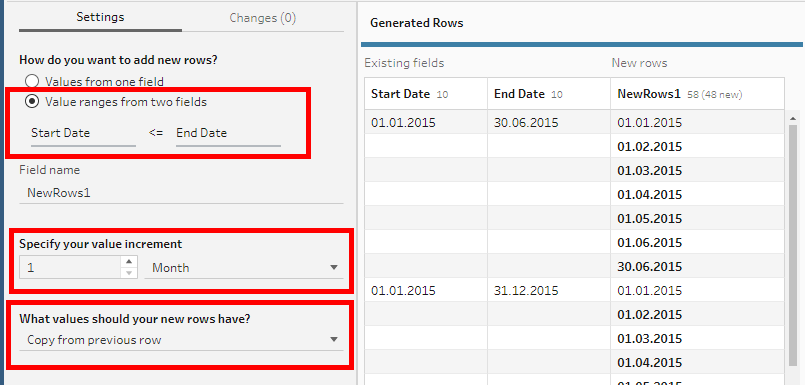
Now we can add a New Rows step in the flow and tell Prep to fill the gaps between the start and the end date at a monthly interval. We also want to copy the values from the previous row.
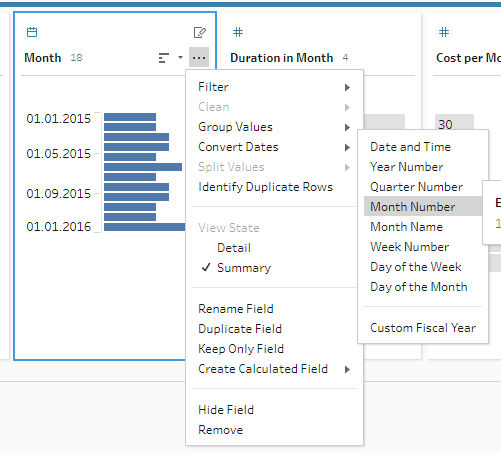
The new column can now be used to generate the months. We can simply use the option "Convert Dates" to get the month number (or name).
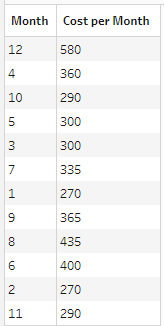
Finally, we can aggregate the expenses grouped by month:
This concludes our exploration of generating new rows in Tableau Prep to make data aggregatable.