


In this post, I will address a type of KPI that requires caution when it comes to aggregation. I call it the "profit ratio" problem. In the context of the standard Superstore data set, the sum is normally calculated for KPIs like sales and profit on an aggregated level; for discount, we take the average. Profit ratio, in contrast, is calculated by dividing profit by sales. Its aggregation can be tricky.
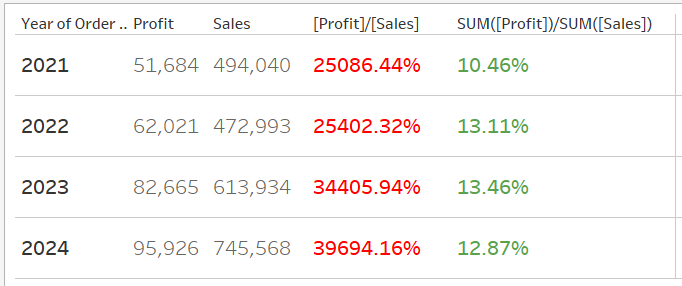
Take a look at the following table view in Tableau. The sums of profit and sales are aggregated on the yearly level. In the two right-most columns, we see two ways to calculate the profit ratio. The red numbers obviously don't make sense, which means we have to calculate the sum of the two KPIs first before the division, hence the formular SUM([Profit])/SUM([Sales]).
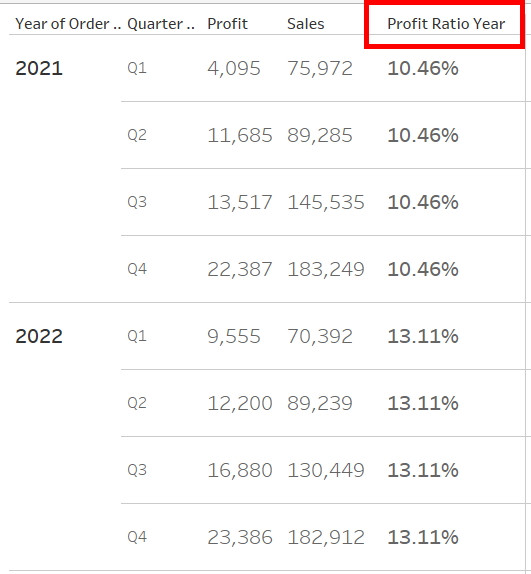
To maintain the level of granularity in, say, a quarterly view, we can write the following LOD expression where the sums of the two metrics are calculated separately by the FIXED function:
{ FIXED YEAR([Order Date]): SUM([Profit]) } / { FIXED YEAR([Order Date]): SUM([Sales]) }
In the following table, while the sums of profit and sales are aggregated on the quarterly level, the LOD expression "Profit Ratio Year" ensures that the values in the column pertain to the yearly level.
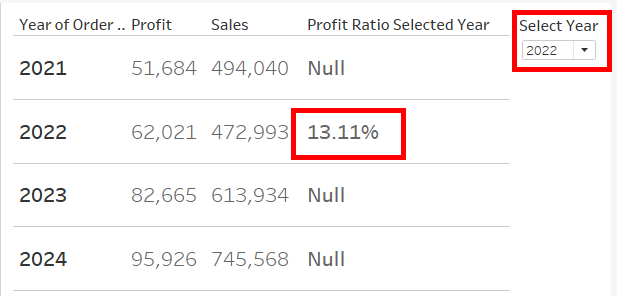
The next use case is to connect the LOD expression from above to a parameter that allows the user to choose a specific year. Here, we first reference the selected year in an IF-statement that determines the time frame for the base metrics. Then, we caculcate the sum at the yearly level using the FIXED function:
{ FIXED YEAR([Order Date]): SUM(IF YEAR([Order Date])=[Select Year]
THEN [Profit] END) }
/
{ FIXED YEAR([Order Date]): SUM(IF YEAR([Order Date])=[Select Year]
THEN [Sales] END) }
In the following dashboard, as the year 2022 is selected in the parameter, the LOD expression "Profit Ratio Selected Year" only returns a value for 2022 in the table.
This article has demontrasted how to aggregate KPIs that are results of a division and how to control the granularity level in visualizations, using the profit ratio metric as an example. Note that while the table view is normally not a desired visual, it is a useful tool to investigate what the calculations return on a certain aggregation level.