


In this post, I will show you how to create a year-over-year dual axis chart in Tableau, with the x-axis displaying the month-year date format of the current year. The following chat visualizes the sums of sales from the current and the previous year using a line and an area chart, respectively. The "current" year is defined by a parameter control on the right. The Superstore dataset used here covers the time span from 2021 to June 2024. When the year 2024 is selected, the chart only shows data up to the current month.
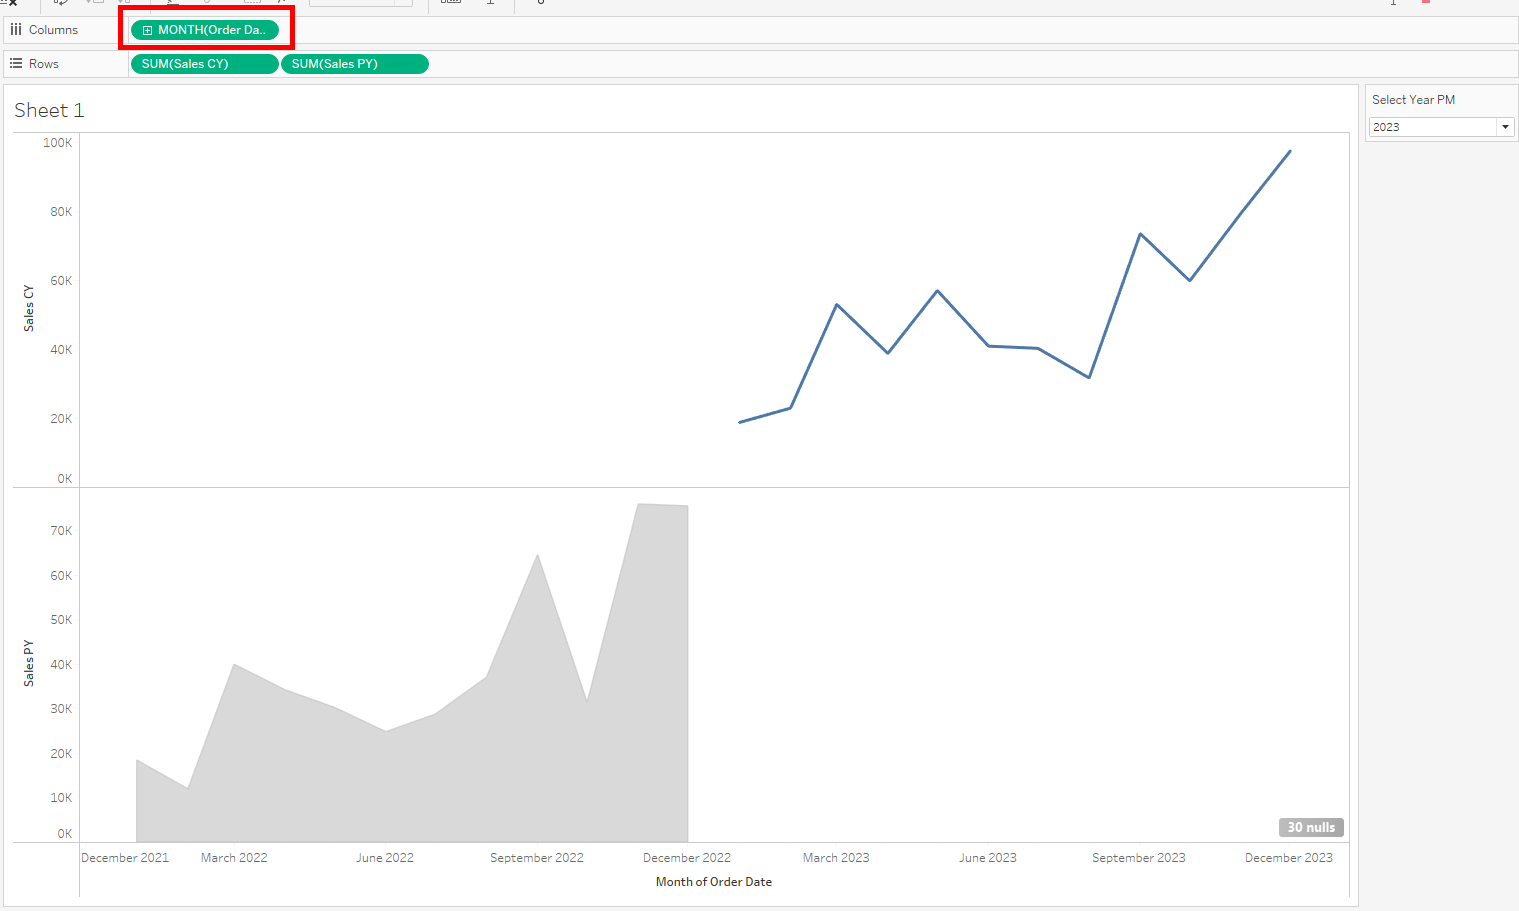
Let's go through the steps from the beginning. Note that I will only focus on the date field and omit the part on how to configure the parameter and calcualted fields for sales. As shown in the image below, if we use the [Order Date] field in the visual, the two years are displayed seperately on the x-axis, making it impossible to create a meaningful dual axis chart.
To display dates from the current (or selected) year only, we can write the following calculation that adds one year to the [Order Date] field for the (dynamically defined) previous year. We will call this calculated field [Dummy Date]. Note that this will only affect the date axis, not the calculation of sales. When dragged onto the Columns shelf, the line and the area charts align in terms of months.
IF YEAR([Order Date]) = [Previous Year]
THEN DATEADD('year', 1, [Order Date])
ELSEIF YEAR([Order Date]) = [Selected Year]
THEN [Order Date]
END
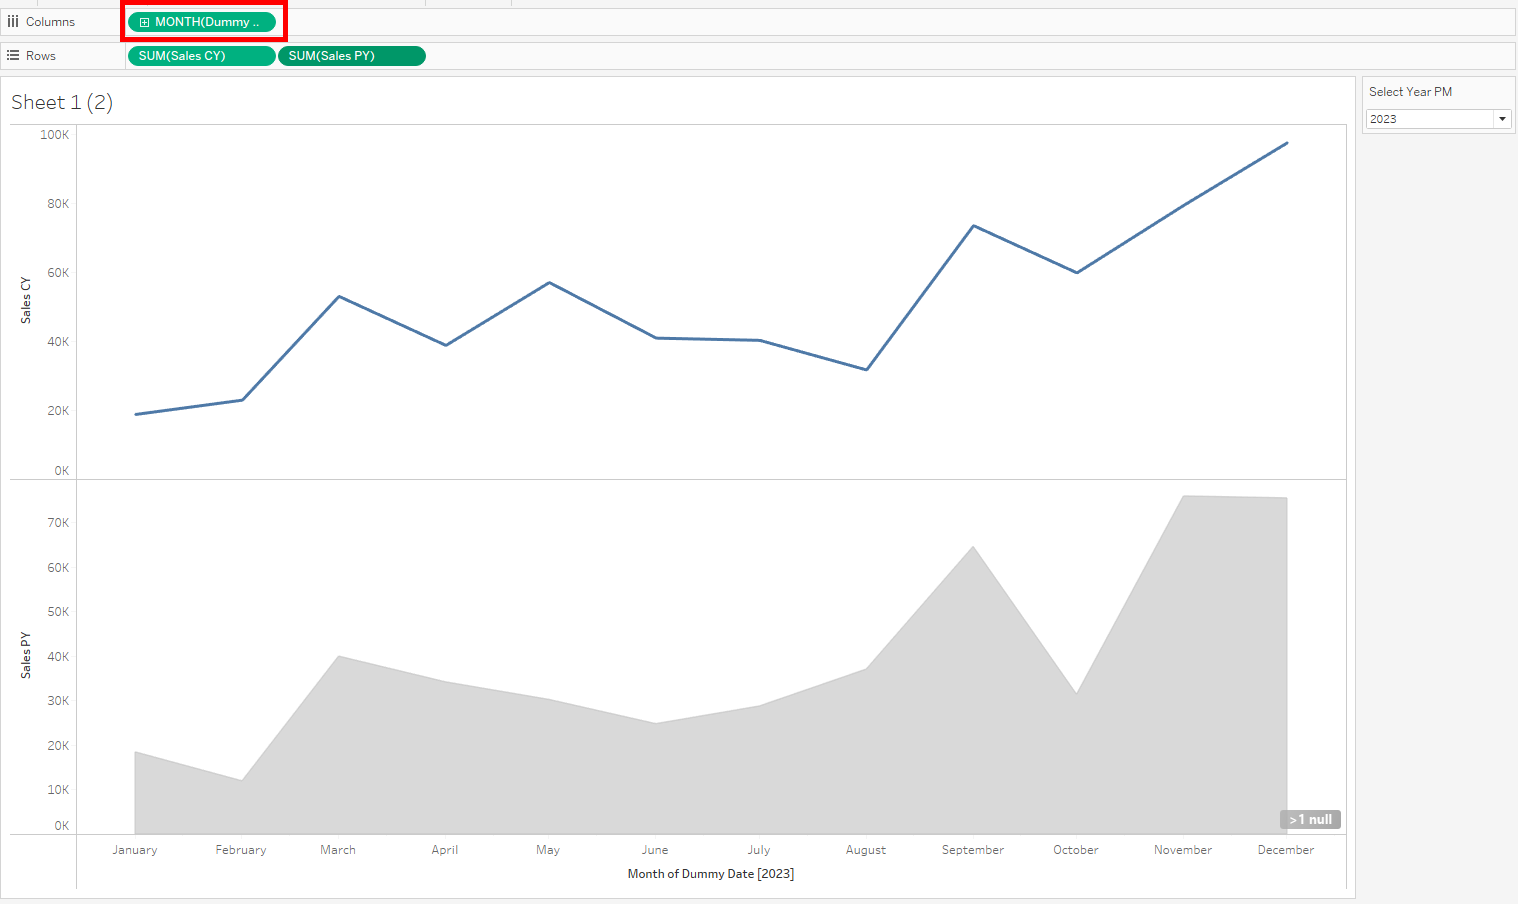
After turning it into a dual axis chart, you will notice that for the current year of 2024, data is only available up to the current month. We could leave the chart as shown in the next image, but the months from July to December of 2023 seem superfluous since there is nothing to compare them to.
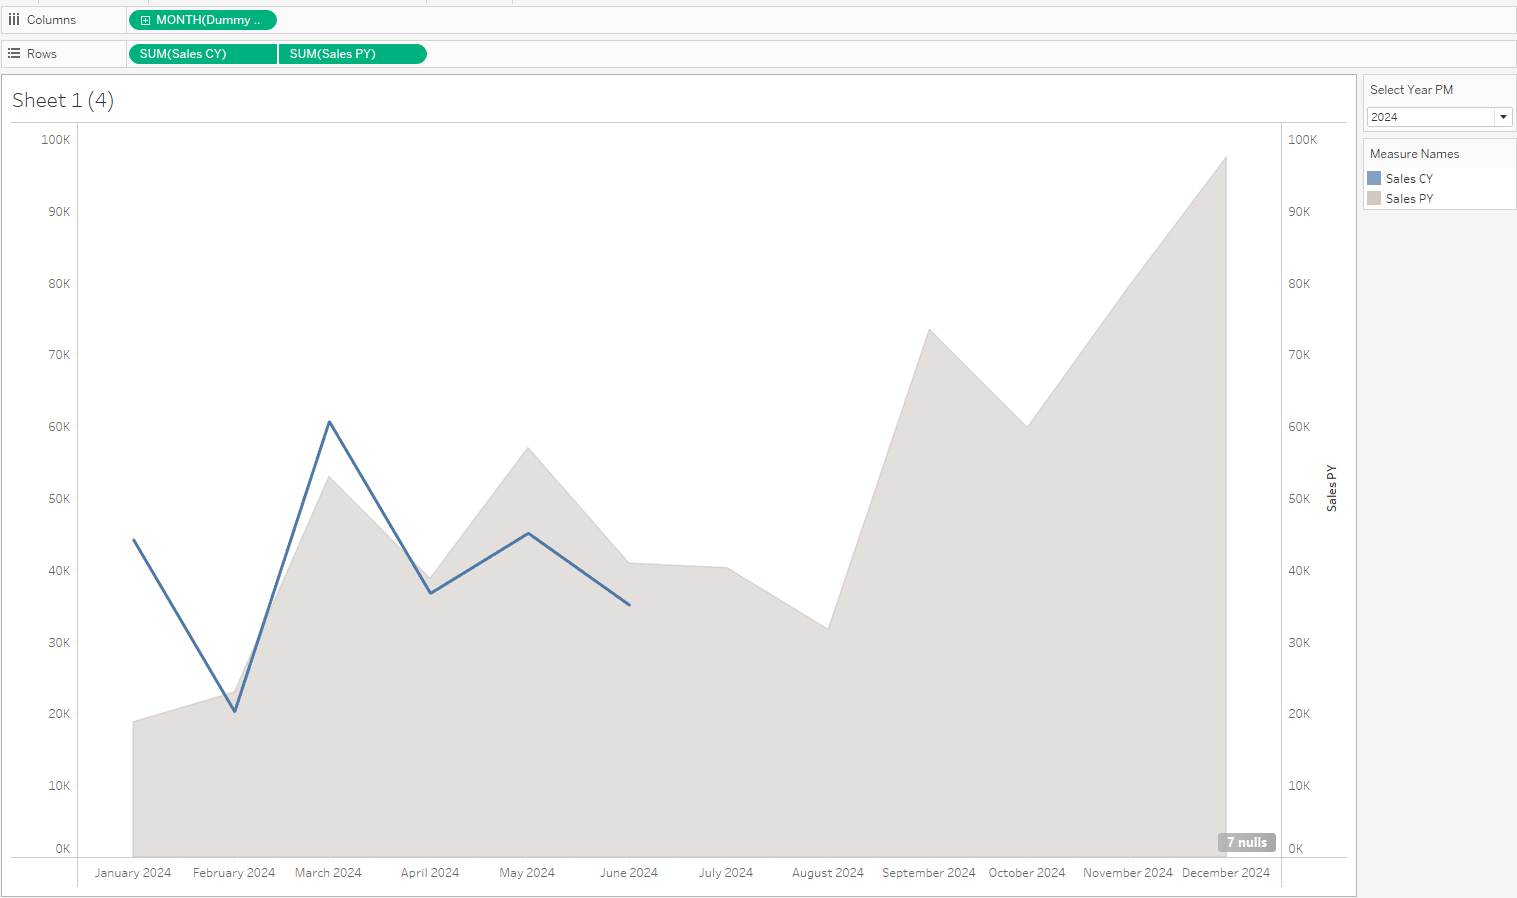
The following calculation can be placed on the Filters shelf to limit the date axis to the current month (see also the first image above):
IF YEAR([Dummy Date]) = YEAR(TODAY())
THEN MONTH([Dummy Date]) <= MONTH(TODAY())
ELSE MONTH([Dummy Date]) <= 12
END
The Dummy Date method is a quick and smart solution to align two charts based on two related date fields. I hope you find it useful.