Hello, everyone!
As promised, here is the third installment of my Alteryx tip series. Today we’re going to be looking at one of my favorite statistical tools: the linear regression. Most people don’t realize how central this tool is to so many industries and cutting-edge technologies. Machine Learning? Regression. Snapchat’s face-recognition? Regression. Google’s targeted ads? Regression. Okay, a data scientist would probably have let out a slow chuckle or ripped off his hair after reading this, but regressions are a truly phenomenal tool for making predictions and finding the deep causes of things.
That’s enough blabla for now, let’s get right into it!
The Problem
Imagine you are an analyst working for a large retailing company. Your boss has just obtained a dataset with your latest sales figures, as well as in-depth survey results data containing a load of demographic and socioeconomic information about each of the stores’ clients. Realizing that he has no idea what to do with the information, he asks you to find some magical way to combine these datasets and somehow gain amazing intelligence from them. In particular, he wants you to build some type of tool you can use to predict future sales. After panicking for a few minutes and wondering why you didn’t pay more attention in that Statistics 101 course, you head to Google and find this blog post. Congratulations! You’re exactly where you should be.
Please note that I won’t actually be explaining what a linear regression is in this post, only how to run one in Alteryx. If you’re interested in the topic, however, I highly recommend you start with this wonderful post!
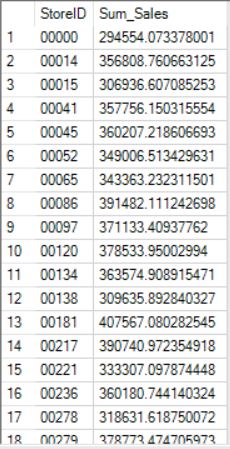
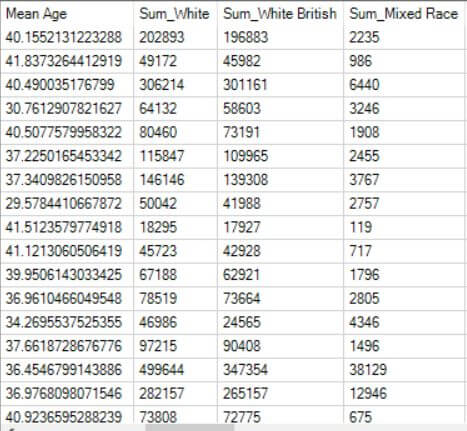
Let’s start by taking a look at the two datasets we will be looking at in this case study. On the left-hand side, you can see our sales data by store. On the right-hand size, you can find demographic and socioeconomic data aggregated at the store level (The data includes many more columns that I did not include in my screenshot for aesthetic purposes).
In order to obtain valuable insights from these two datasets, we are going to have to complete the following steps:
- Join both of these datasets and prepare them for our analysis,
- Create a simple regression model that we will use to predict sales figures based on our list of demographic and socioeconomic variables,
- Check the accuracy of our model.
I know this may sound complicated now, but I promise that you’ll be more than capable of getting this done by the end of this article. Let’s get cracking!
The Solution
The workflow we will be building to complete all the tasks described above will be organized in the following way:
- First, we will join both datasets into one large dataset (we will do a left join using the StoreID column),
- Secondly, we will split our data into two datasets: a Training set that we will sue to build our regression model, and a Test set that will be used to evaluate the accuracy of our regression model in predicting sales figures,
- Thirdly, we will build our regression model. We will be regressing Sum_Sales unto all the other variables included in our dataset, using the Training dataset generated previously,
- Finally, we will evaluate the predictions of our regression model and test its accuracy.
Before I reveal what the workflow looks like, let’s dig deeper into some of the key tools and techniques you’ll be using.
Creating your Training and Test datasets

In order to be able to estimate the accuracy of our regression model, it’s important that we divide our dataset into two parts: a Training and Test set. The training set will be used by the Linear Regression tool to create the regression equation that will lie at the heart of our regression model. The Test set, on the other hand, will be used in our Score tool to compare our estimated sales figures with the actual sales figures that are included in that Test set.. By doing this, we can check how accurate our regression model is in predicting sales figures using the customer information available in our dataset. Let’s take a look at our Create Sample tool to check how we’ll be configuring it.
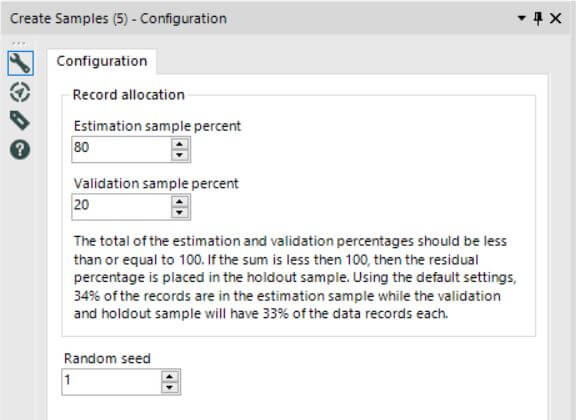
As you can see, we will be placing 80% of our data into our Training set (the Estimation sample percent) and 20% into our Test set (the Validation sample replacement). Leave all the other options as default, and voila! You’ve successfully created the samples you’ll need from your data.
Building your regression model and testing its accuracy

The core element of this entire workflow will be the Linear Regression and Score tools. The former will be used to build our regression model – the “engine” of our analysis – while the latter will allow us to use our Test dataset to check the accuracy of our predictions. Let’s take a look at the configuration of both of these tools.
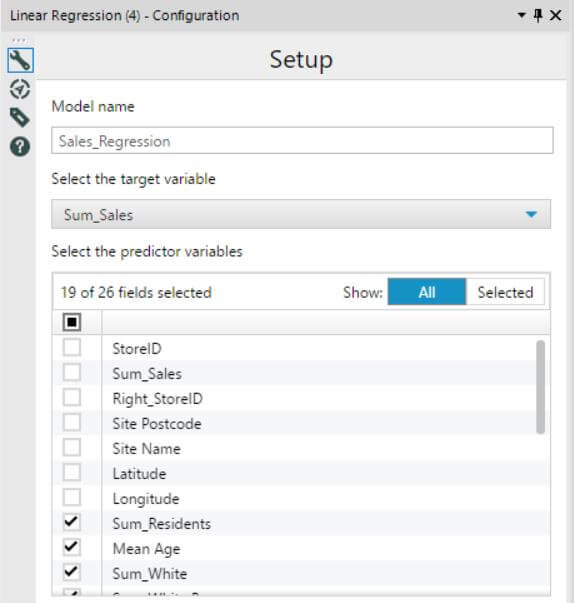
Here is the screenshot of the setup for our regression model. All you are going to want to do is:
- Give it a name – mine is called Sales_Regression,
- Select the dependent variable in your regression, or the variable you will be predicting. In this case, we’ll be selecting Sum_Sales,
- Pick all the regressors, or variables you will be using to make your prediction, from your list of fields. As you can see, I’ve removed all the useless ones that provide no demographic/socioeconomic information, as well as the dependent variable itself, Sum_Sales. Trying to predict sales by using sales doesn’t make much sense, does it?
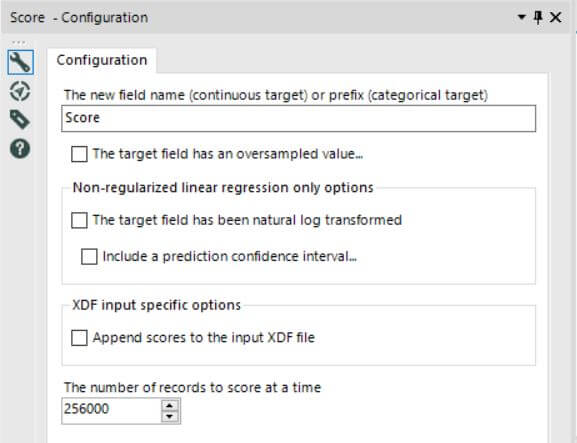
As for the Score tool, here’s what it looks like. As you can see, there’s nothing to do here, you can even keep the default name Score that the tool preselects for you.
With all these concepts and tools in mind, let’s finally take a look at the workflow we’ll have to build to get our insights!
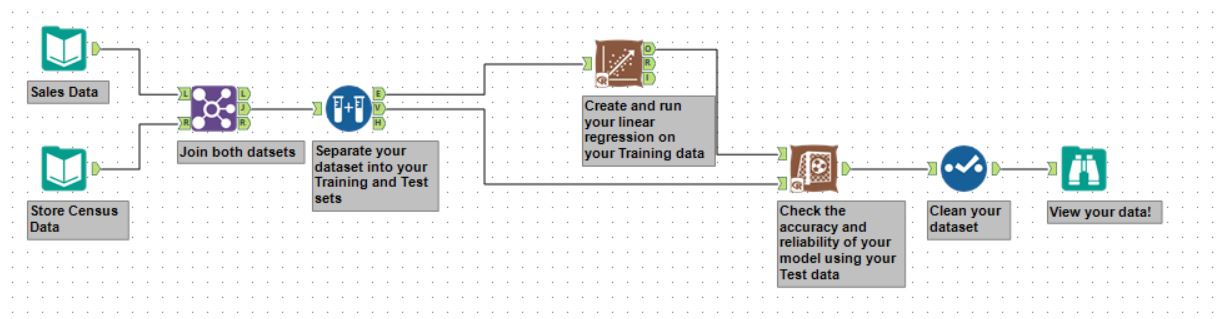
- Start by importing both datasets: the Sales Data and the Store Census Data. We use a left-join by StoreID to unite them into one dataset,
- Then, use theCreate Samples tool to generate the Training and Test sets,
- Connect the Linear Regression tool to the top connector of the Create Samples tool: this will connect it to the Training dataset. Afer this, configure the regression as previously shown,
- Add the Score tool and connect the top connector to the top connector on the Linear Regression tool, and the bottom connector to the middle connector on the Create Samples tool – the Test set. Configure it as shown earlier,
- Use the Select tool to remove any unnecessary fields, and add a View tool to check your output!
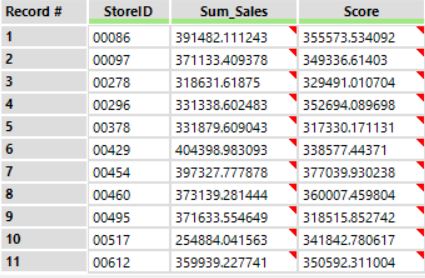
If you’ve completed all these steps correctly, you will obtain an output that looks like the one shown below. The Sum_Sales column shows the actual sales figures for each of the stores, while the Score column shows what our regression model predicted the sales would be based on the demographic and socioeconomic data for each store in the Test dataset. You can now import this into Tableau, and give your boss some pretty neat insights!