


Today is day three of our intensive final week of the 4-month Data School training. Our task on this day was to use Alteryx to make API calls and retrieve data from the AirVisual API, followed by the creation of a dashboard.We need to create a free account and select country, state and city data of our choice. Our goal was to create an engaging, exploratory dashboard complemented by a compelling narrative for our upcoming presentation.
The AirVisual API can be accessed via the link provided. However, working with this data comes with some challenges:
- Limited capabilities with the free account, such as the inability to access historical data beyond the current day.
- Retrieving specific regional data requires the specification of country, state and city.
- Access to global city rankings is restricted with the free account.
- Run the workflow is time consuming.
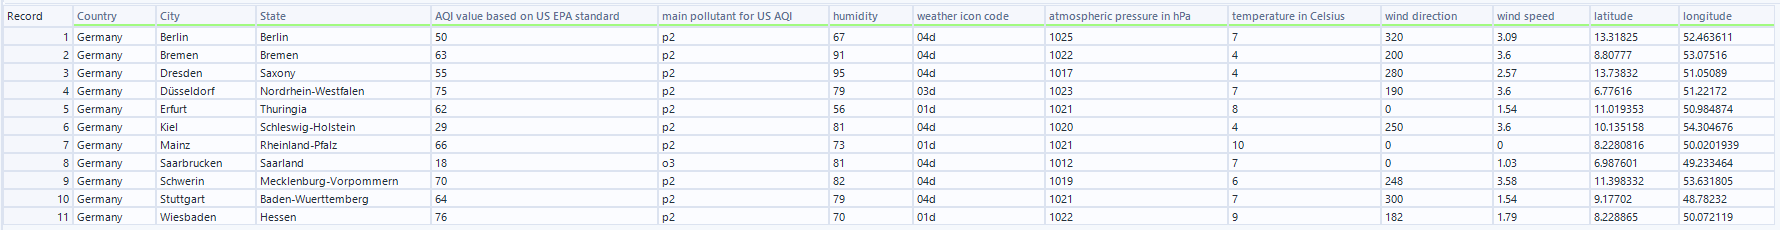
Upon completion, I was able to retrieve the following data
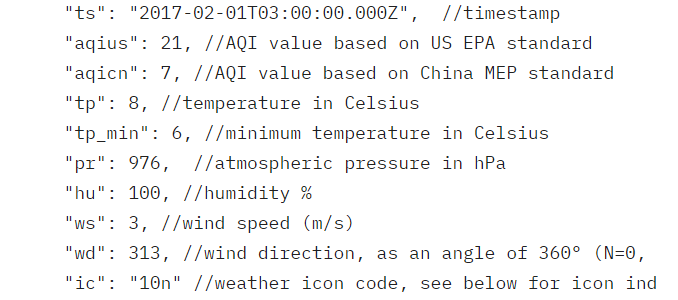
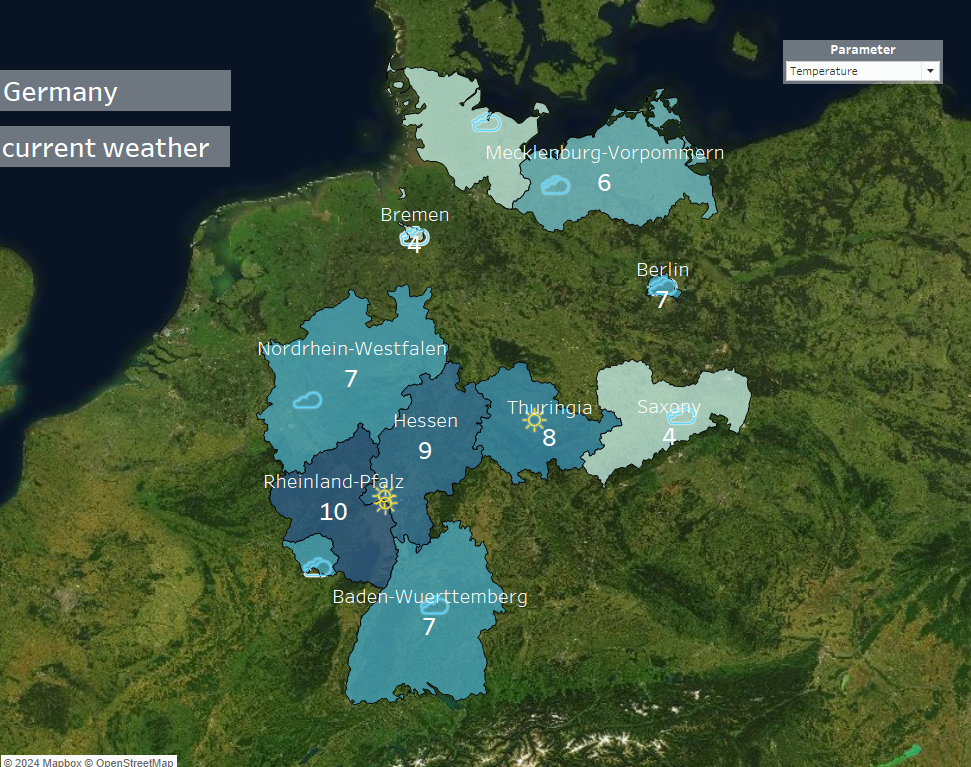
I also wanted to use weather icons, which you can find in the AirVisual API documentation.

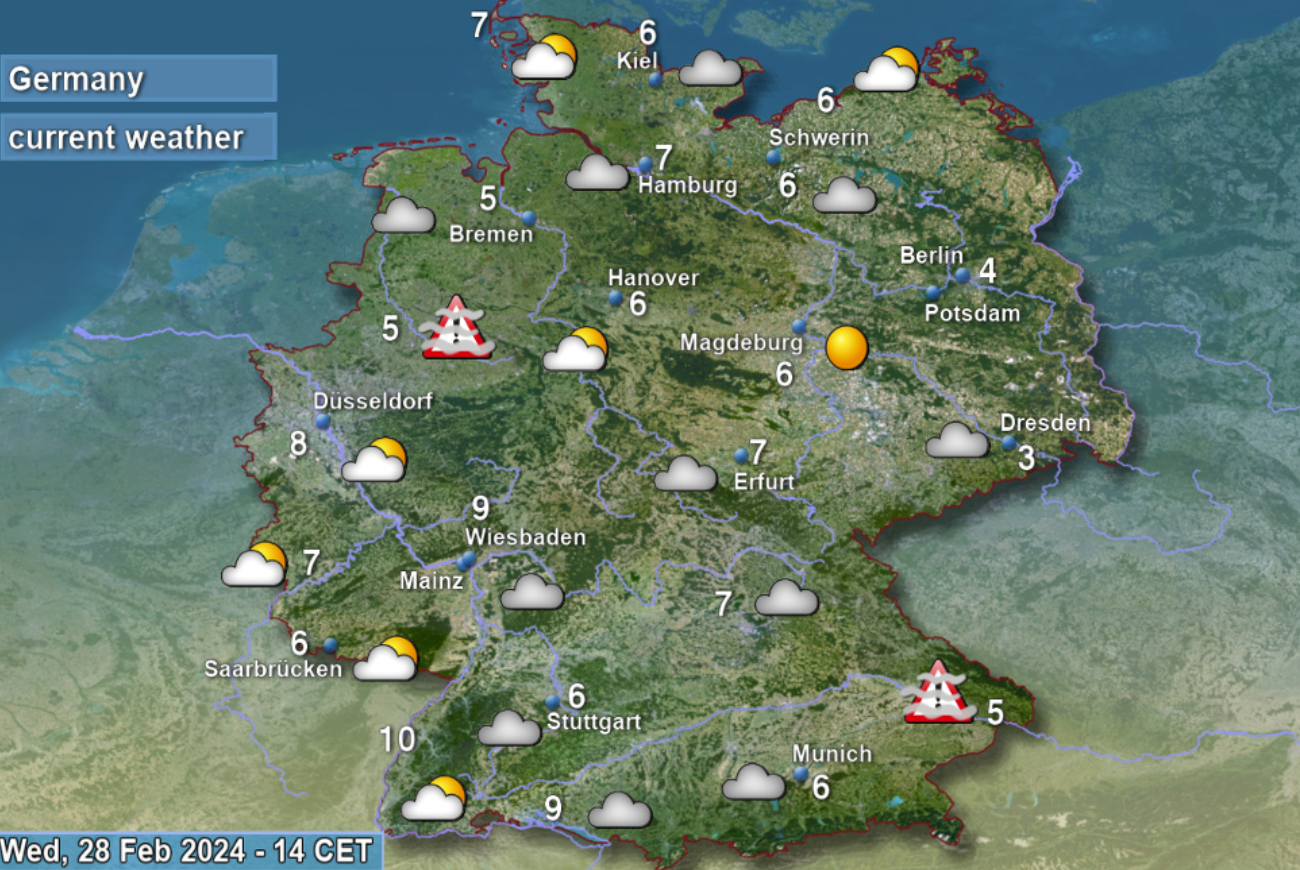
I was planning to create a weather map for today for Germany that would show all regions and temperatures. I also wanted to add a parameter to see humidity, atmospheric pressure, wind direction and speed.
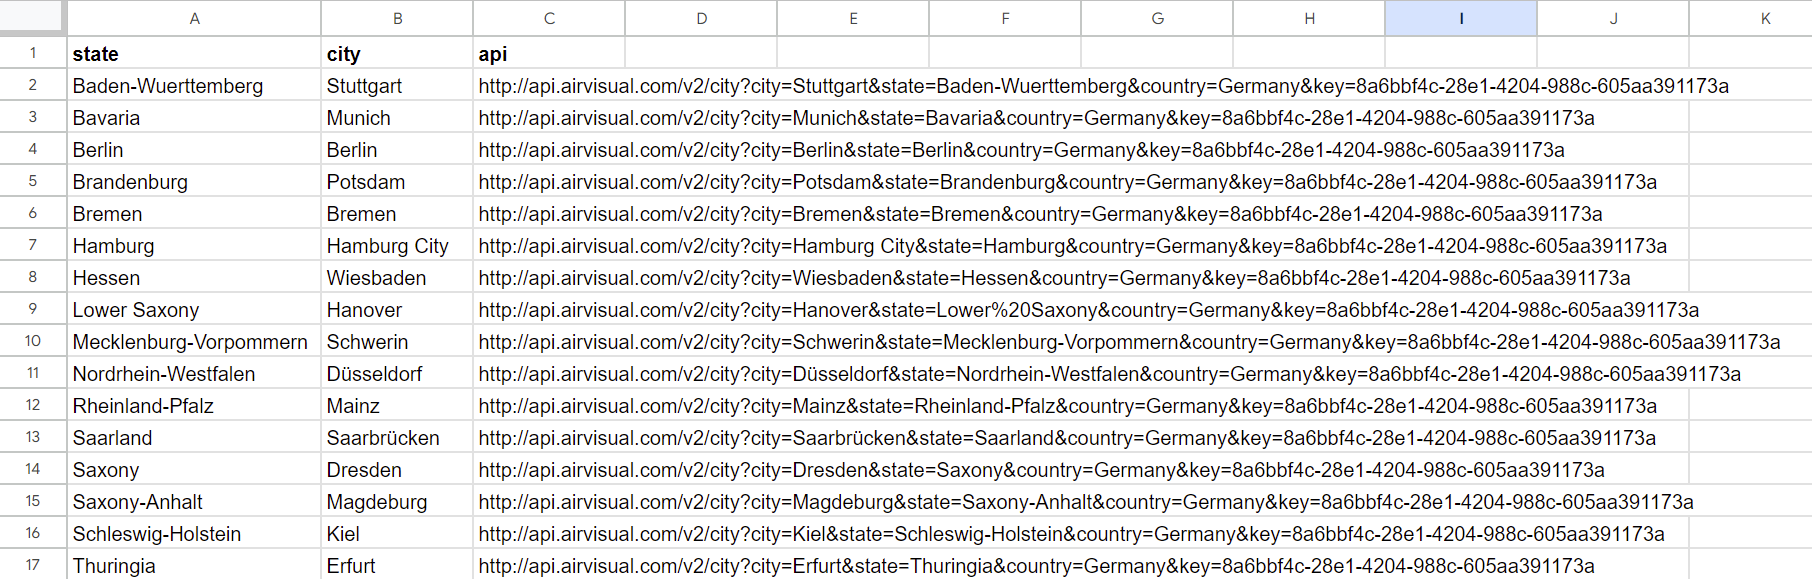
First of all, I created a list of German states and cities from which I want to retrieve data:
I then created an Alteryx workflow:
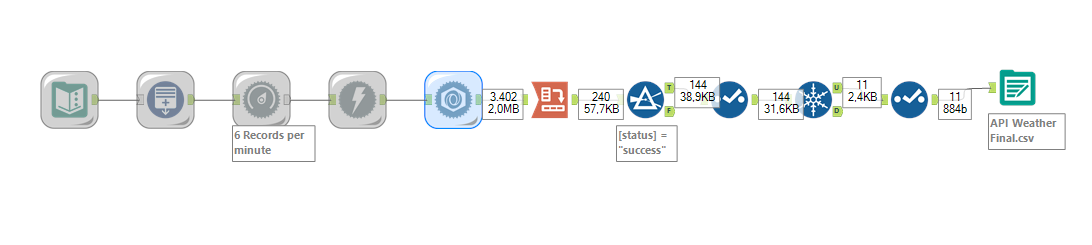
The end result in a .csv file is as follows:
My dashboard looked like this:
What was good: It was interesting to work with Alteryx and deal with data preparation and API calls. I also found an interesting idea for visualization, although at the beginning I thought that with a free account we wouldn't be able to find anything that is worth to visulize.
What could be improved: Run the workflow took a long time. I started working with mockup data to create a dashboard, but at the end I found that not all api calls worked correctly and some data was missing.