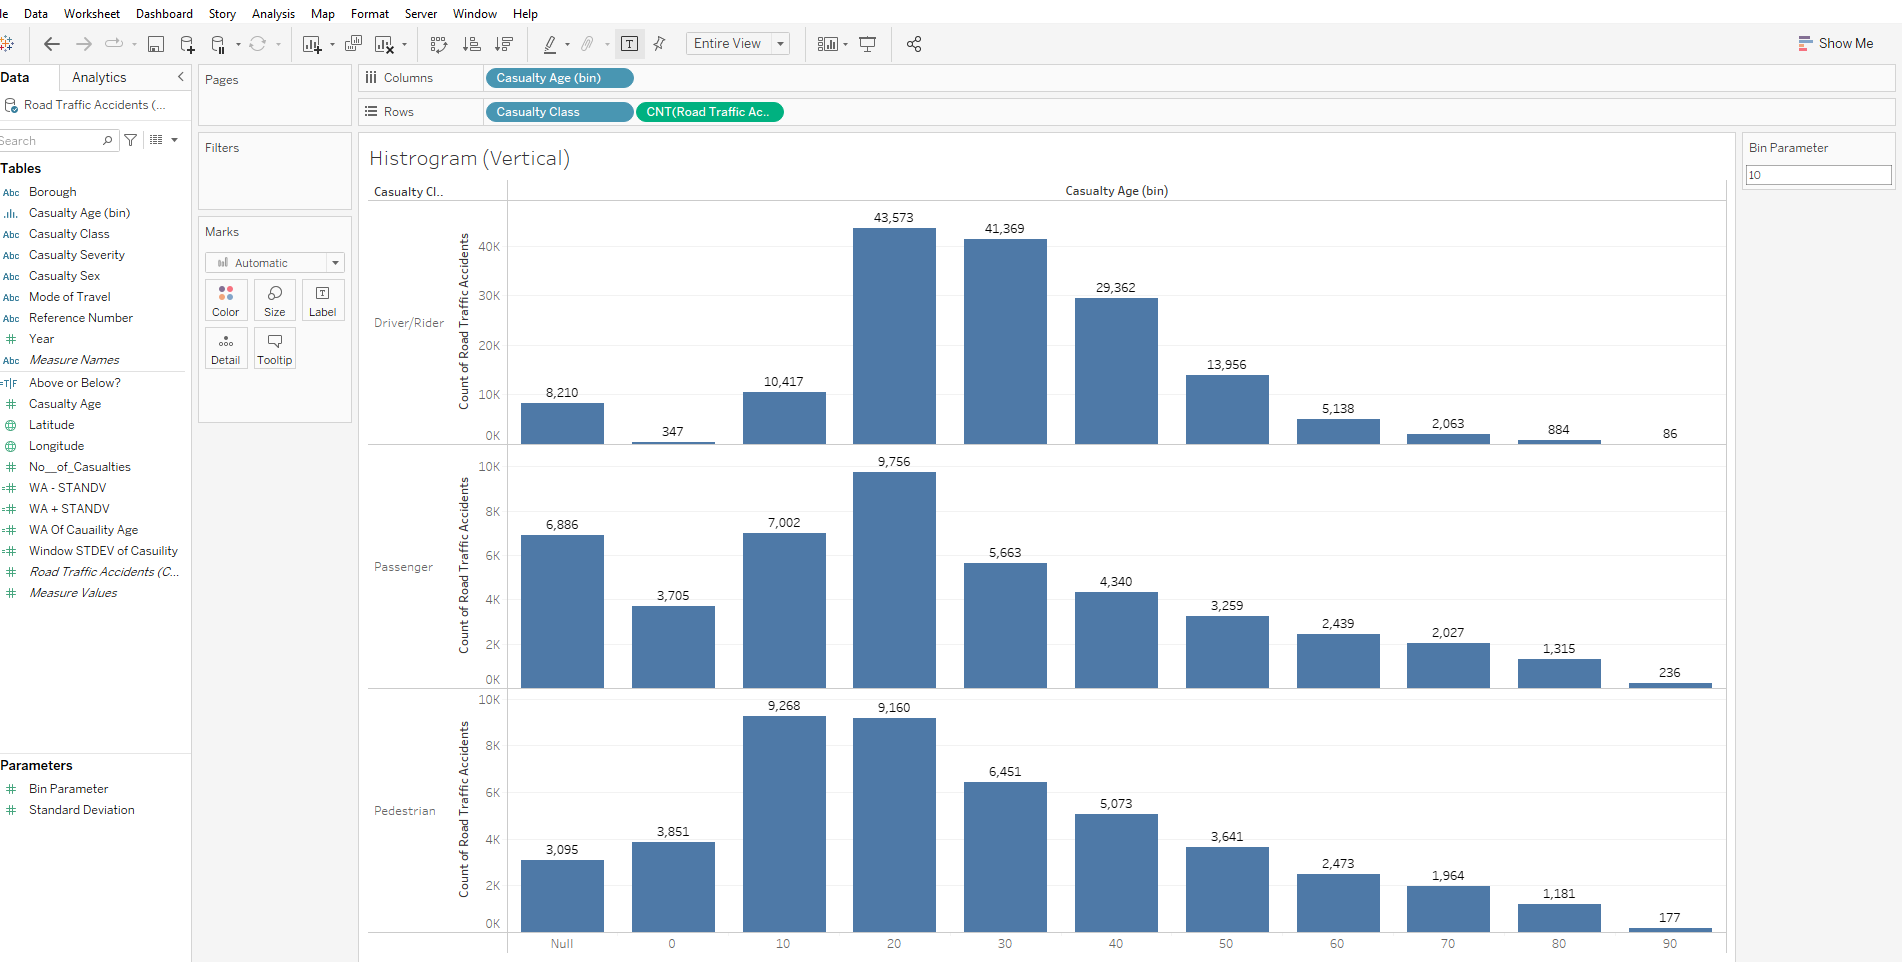
Histograms provide a graphical representation of the distribution of numerical values. They look similar to bar charts but are different. Bar charts compare different categories of data while histograms display the distribution of a variable.
To make a histogram, bins of EQUAL size are constructed - each bin is plotted as a bar & the height corresponds to how many data points fall within each bin (Bins can also be referred to as "intervals", "classes" or "buckets")
Let's explore an example:
I want to create a dynamic histogram in Tableau showing the distribution of casualty Age across road traffic accidents in London by casualty class
Steps I took:
- I Inspected the data - remember it's important to check your data has the right shape & relevant fields for your calculation
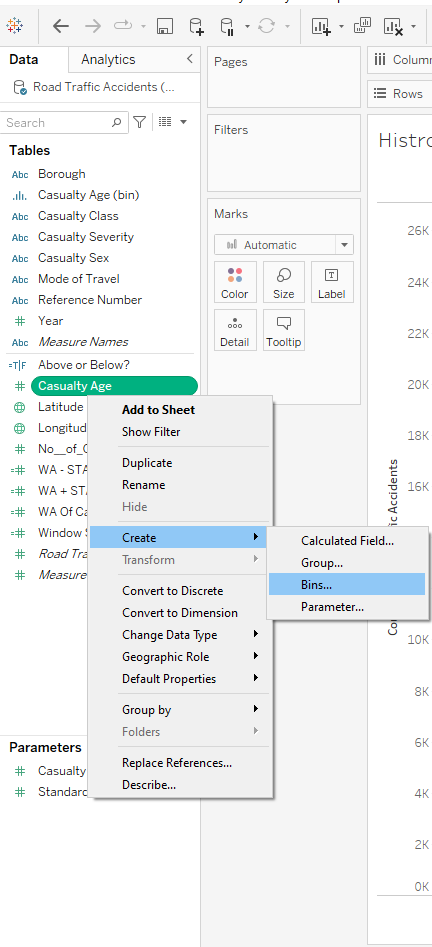
- I Right-Clicked Casual Age, went to Create and selected Bin
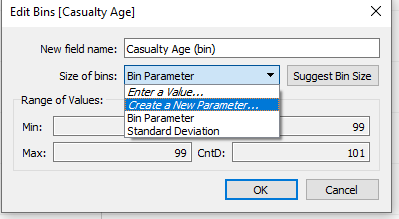
- I clicked the drop-down menu and created a parameter - In the current value, I selected how big I initially wanted the bins, clicked all values, clicked ok and showed the parameter
(It's important I create a parameter at this stage to allow the histogram chart to be dynamic, allowing the user to control how big the bins will be)
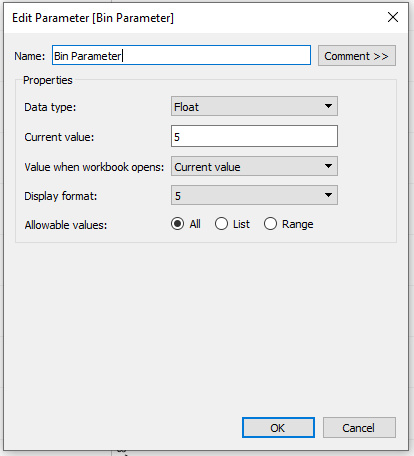
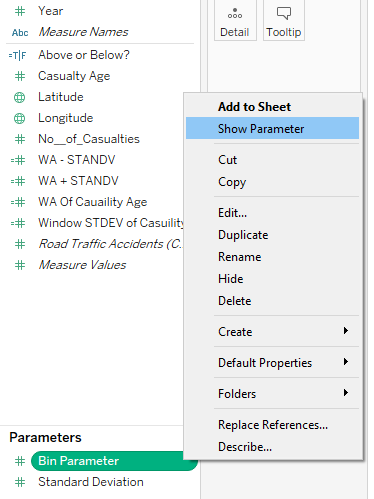
- Now a new field should be created in the data pane

- I dragged the bins to the columns & add the count of road traffic accidents to rows
- I also added casualty class onto the rows before the count of road traffic accidents, so the view can be broken up by Driver/Rider, Passenger and Pedestrian

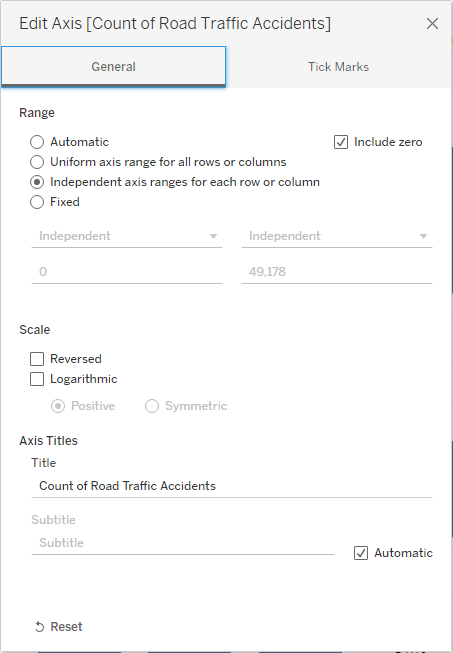
- As the scales are quite different I edited the axis to be independent of each other - Right Click Count Axis - Edit Axis
- Now that my chart is finished, I can go into parameters and change the size of my bins to a higher or lower value
