Historical price data can be used by investors and analysts to back-test pricing models or investment strategies, to mine data for patterns that have occurred in the past, or to detect technical indicators for day traders, among other uses.
Market data in particular, generally refers to pricing information, such the last trade price or the current bid and ask price of an instrument, however it also includes numerous other data points:
· volumes
· timestamps
· volatility levels and other factors that shed light on supply and demand
All of this information is highly valuable for market participants seeking to understand and analyse market dynamics. Market data is different from, but complemented by, fundamental data which
provides information about an underlying entity’s performance like company revenues or from macroeconomic data.
Data sources: I found, this historical data from yahoo finance which is one of the best places to get historical data.
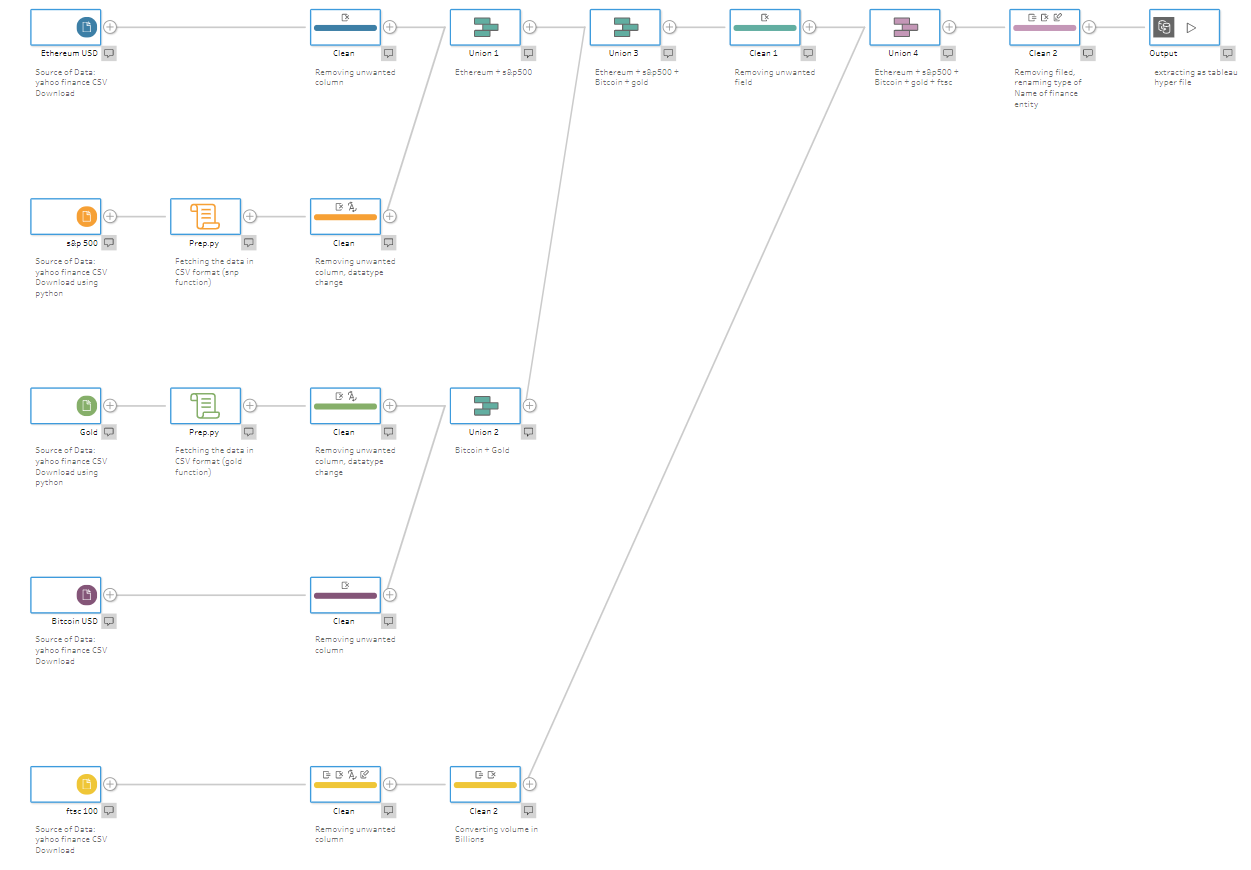
In order to find out best investment strategy, i downloaded s&p 500,ftsc 100, gold and crypto currency ( bitcoin and ether ) csv format. Most of them are readily available in csv format except snp500 and gold historical data. Therefore, i used tableau prep to scrap the data.
Once its downloaded, its was in pretty much clean dataset, didn’t require much of cleaning. However, my use case was to compare beat investment strategy. Hence, I took all the data to prep and union all of them and did some cleaning after grouping them. It was ready to analyse. I extracted data in tableau data source file (.hyper) since I was planning to use it in tableau desktop. But it can be outputted in .csv or excel format using tableau prep for wider audience.
My flow:
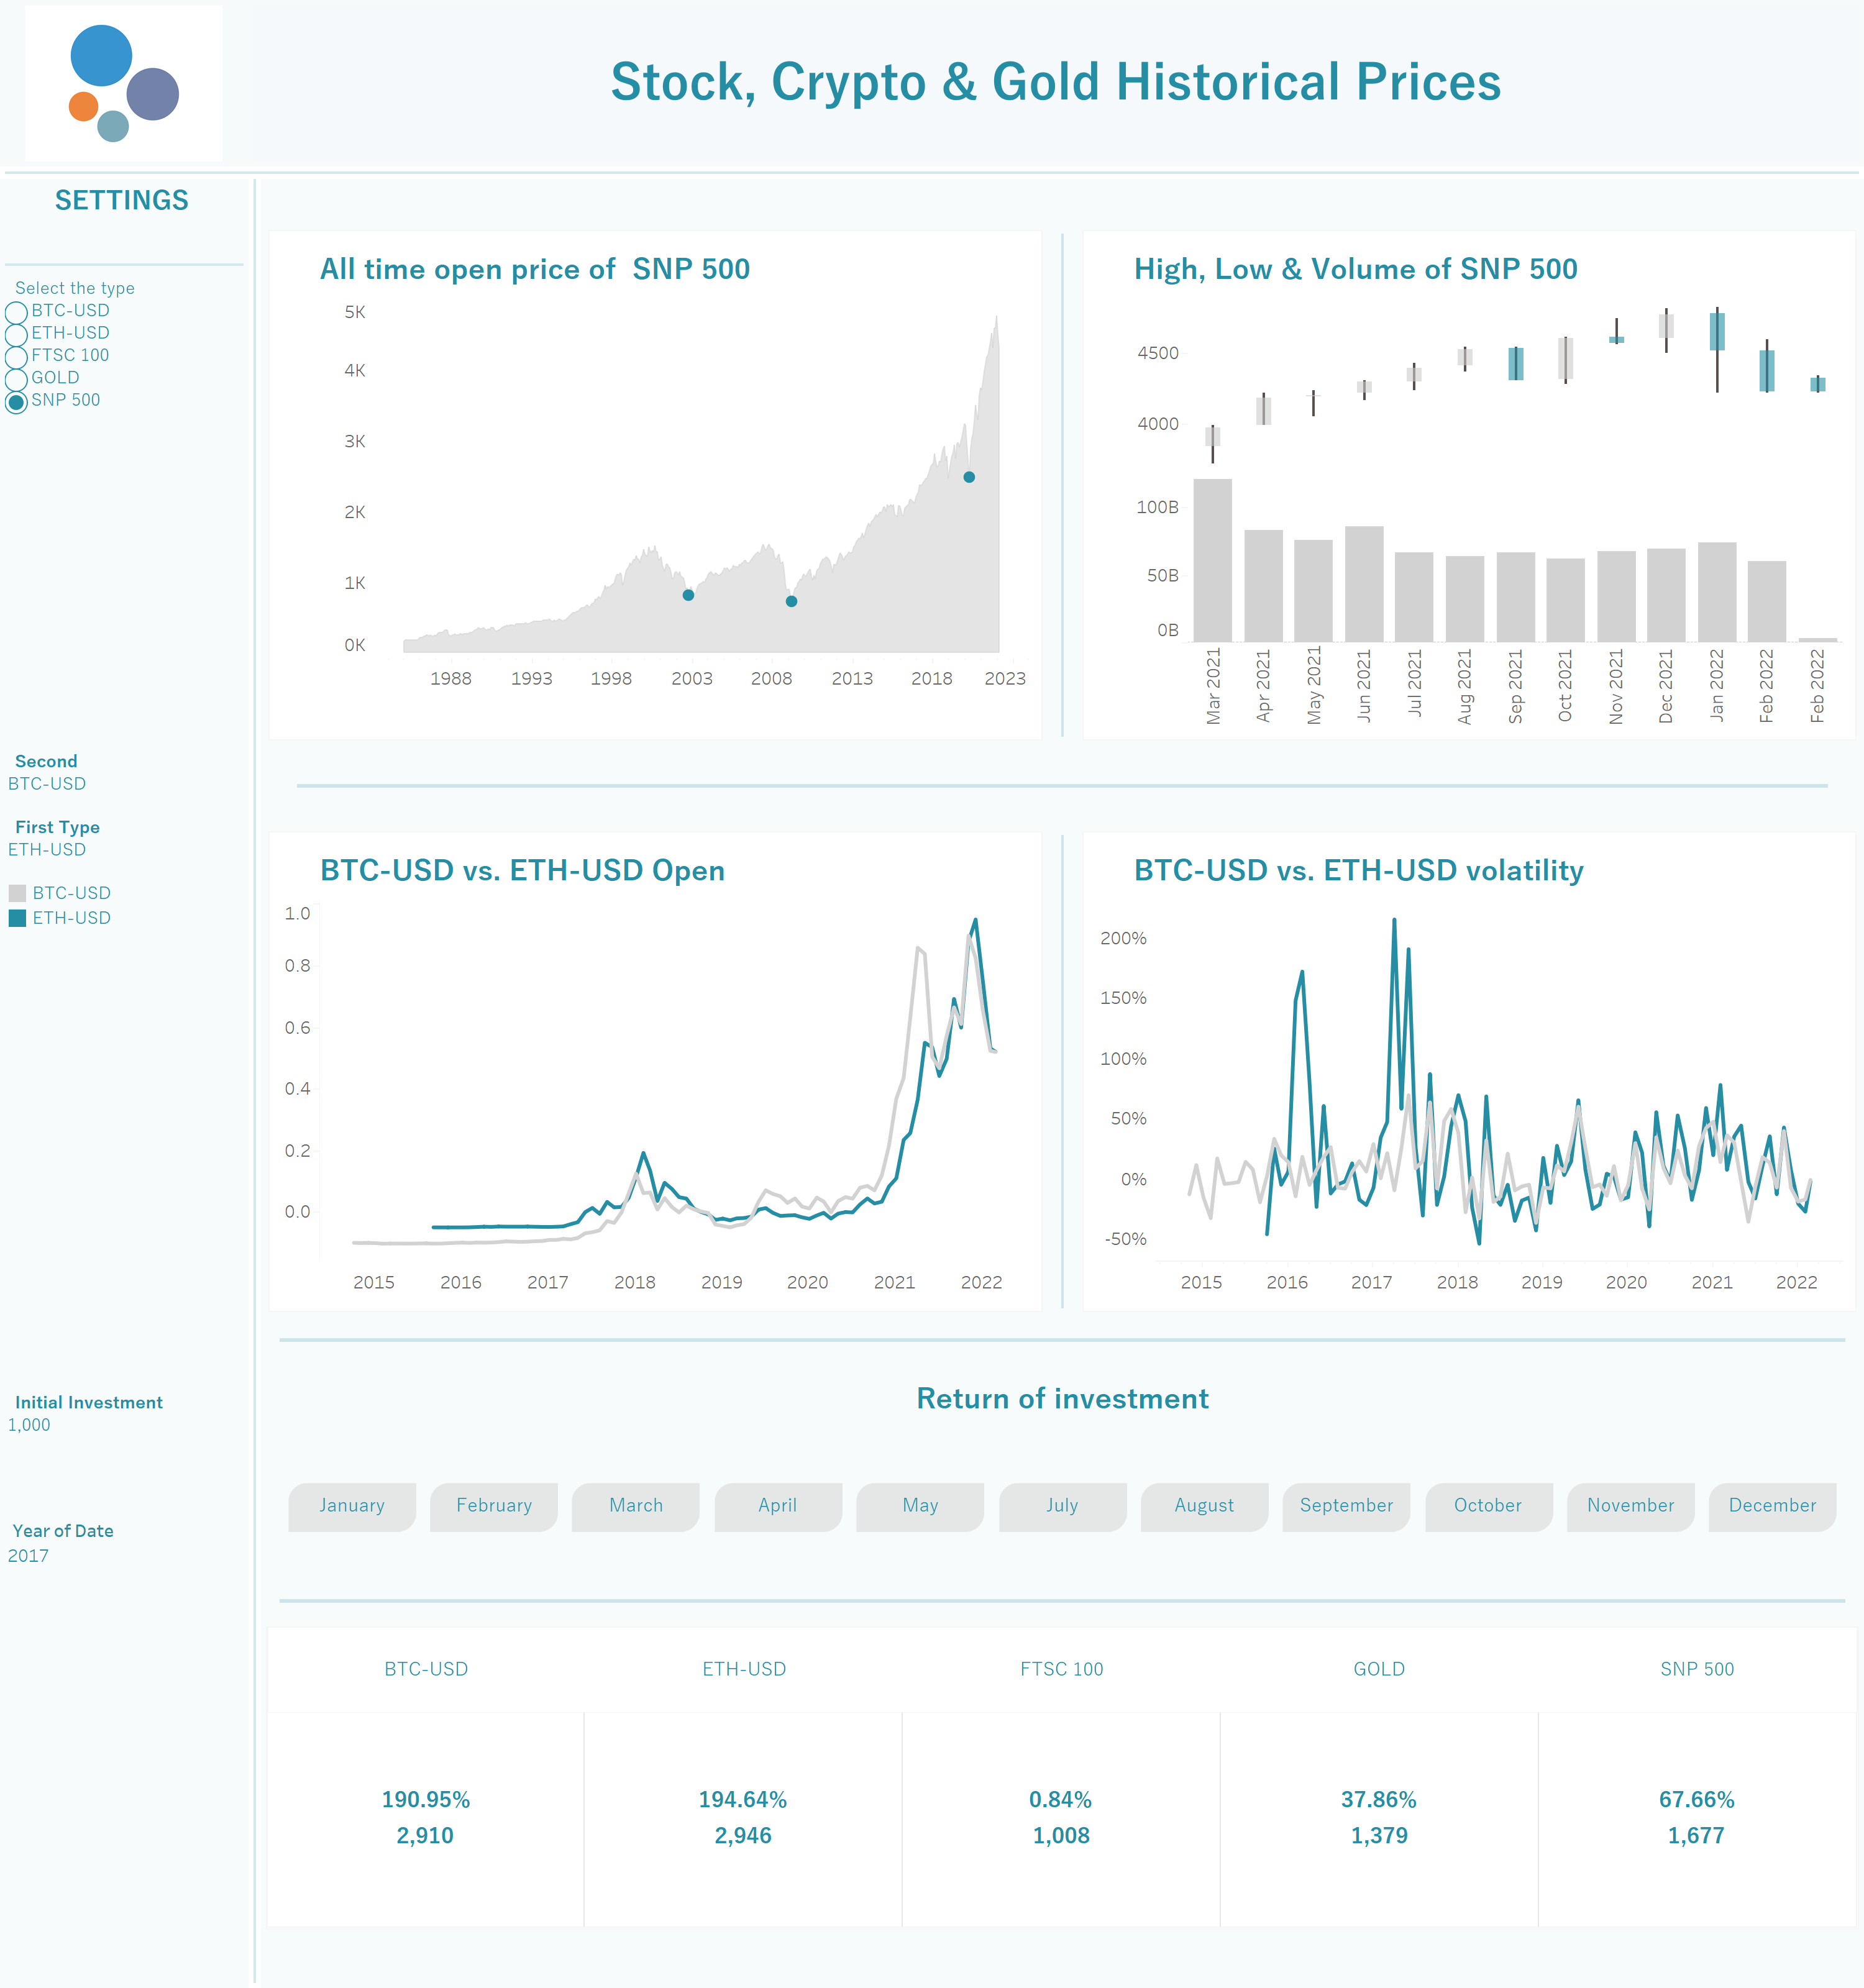
The data i used for my analysis id monthly historical data. To compare these data i needed to normalize it. Which is available on tableau public profile.
I decided to look for some pattern over period of time breakdown in
Its highs, lows, opening and closing price.
Another aspect I used is correlation between them. For example, ftsc 100 is highly correlated to snp500. Similarly, bitcoin and ether. To add more, I created little calculator of returns of your initial investment.
Lastly, To give gist of how we can analyse it, the dashboard using tableau desktop available on tableau public.