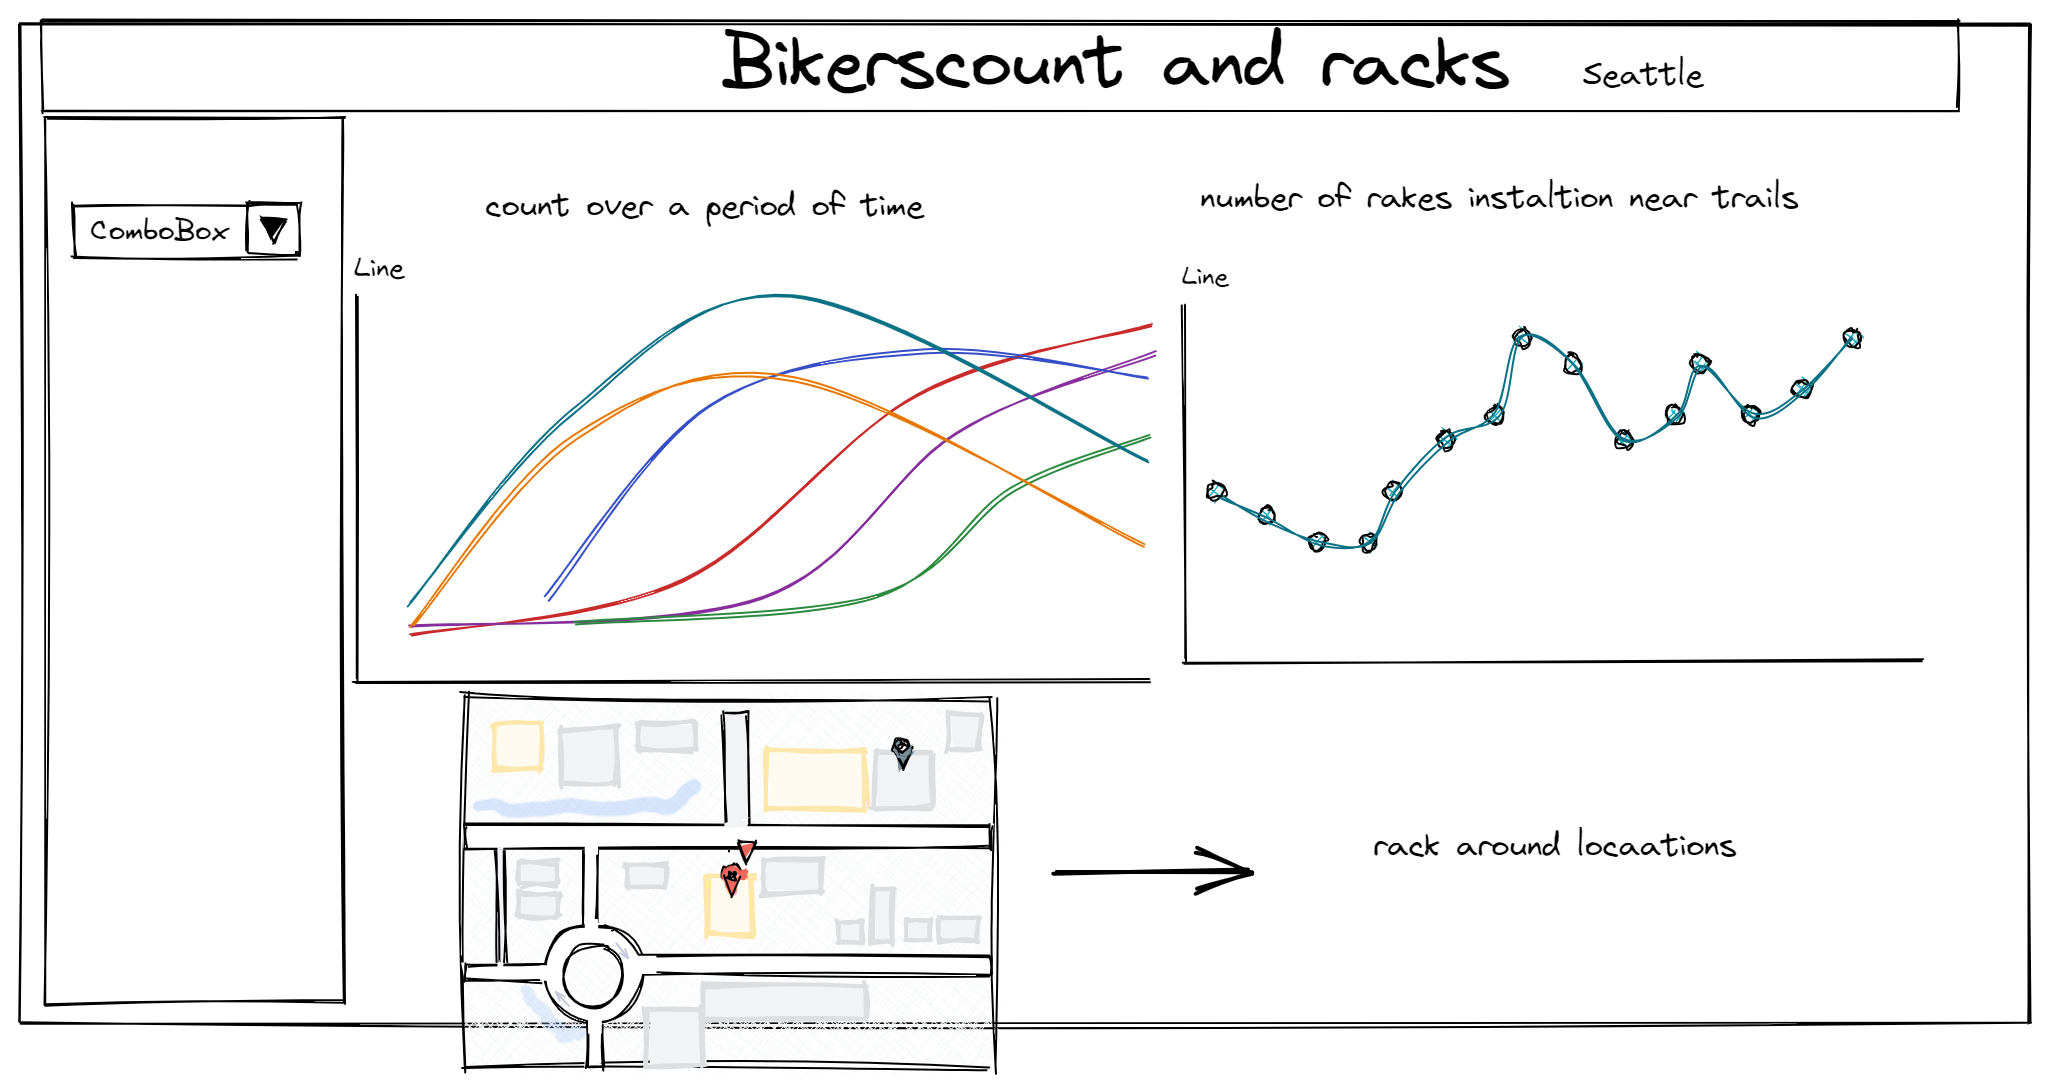
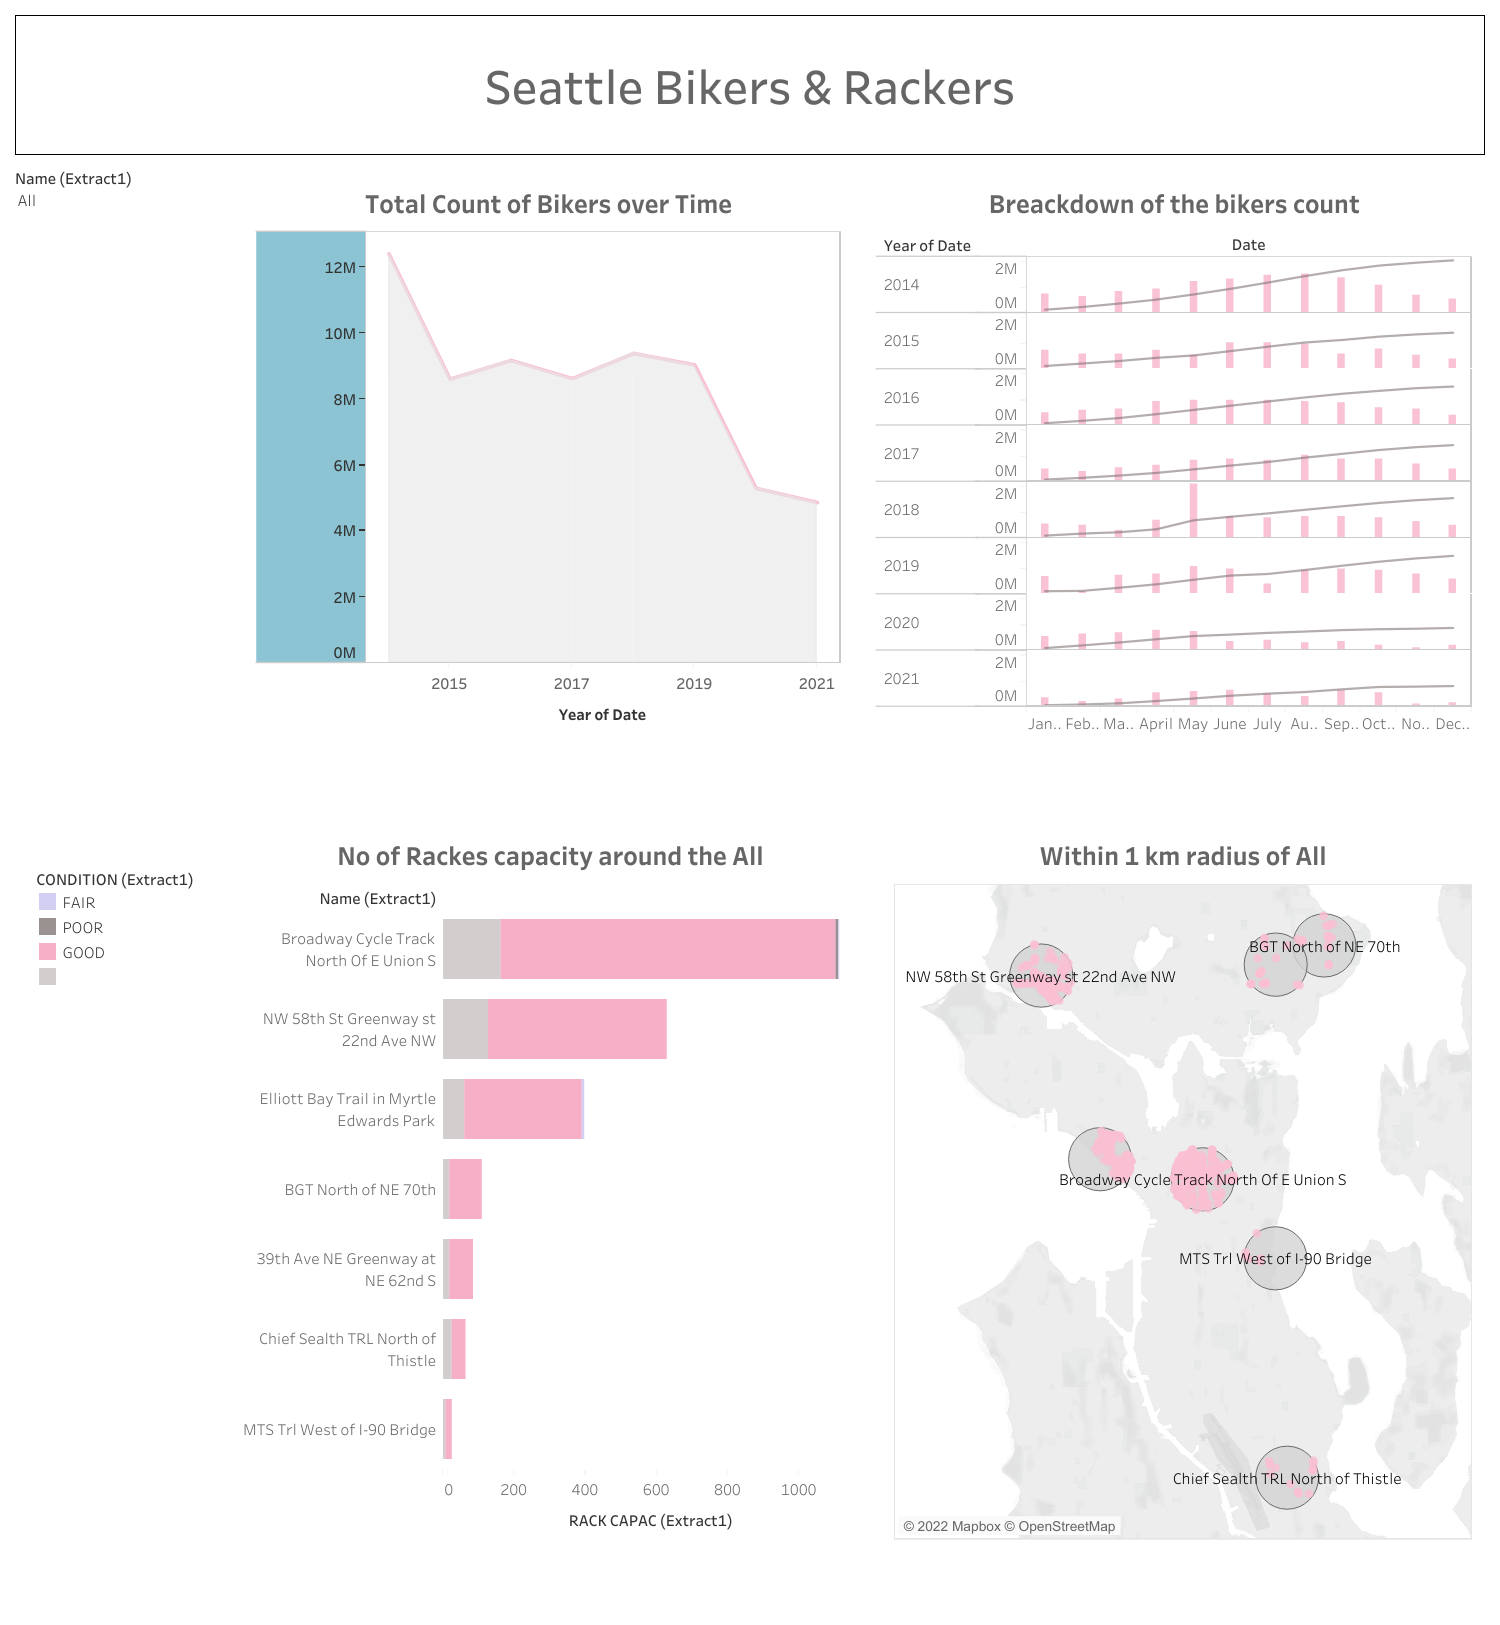
Today's objective was to create entire dashboard using tableau 7 however we couldn't download one. Therefore it changed to Web edit.
Today's data was about bike/pedestrian counter in the city of Seattle. i decided to add more content i decide to add cycle racks dataset to it.
My initial plan was to analyse the dataset how biker count correlates to bike racks. is it driving any increase or decrease in the count over period of time or the other way around.

Data Prep: I would say, I spent almost 4 hours on it. Including finding the extra data to prep and combine it.
Dashboard designing with webedit is a work. There are many things which cant be done properly on web edit for example formatting is pain, cant edit the data sources and it can be endless list.

