


Call the redcoats because this task was a crime! Today we were tasked with pulling some UK crime data using an API and creating an analytic app that could allow the user to make some key decisions such as the crime category or date before downloading the data. Finally, the data had to be live connected to a Tableau dashboard that could update in the moment.
I had feared the API day(s) but it turned out to be a good challenge and I learned a lot about preparing them in Alteryx as well as how to refine the analytic apps. Let's briefly go through what I did today, the struggles I had ,and the final products I was able to create.
- Preparing The Data in Alteryx
The first task was to bring the API into Alteryx so we could easily pull and prepare the data. Fortunately, no API key was required so downloading the data consisted of a few simple steps.
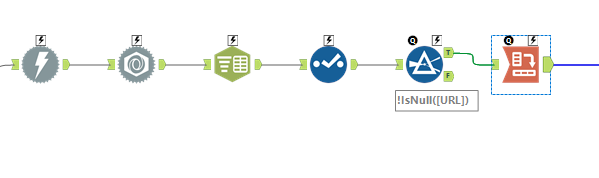
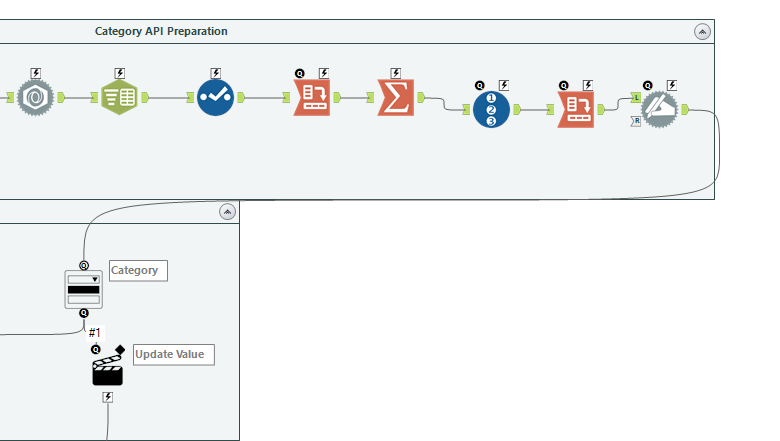
The few tools below were all that was required to actually pull the API. Starting from left to right we have the download tool to take everything from the given API, the JSON parse tool to split out the data, the text to columns tool to take the row number and separate it from the columns, a select tool to clean things up, a filter tool to get rid of nulls and finally a crosstab tool to structure the data correctly.
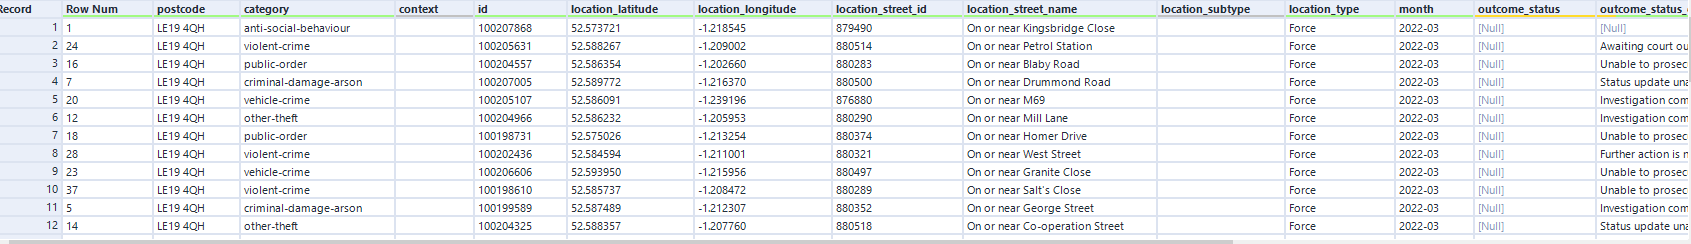
Pictured below was the data structure that was going to be brought into Tableau, but before I started visualizing I had to create the analytic app to give the user options to define exactly what the API was pulling.
There were three parts of the API that had to be set up for user options: The date, the category of the crime, and the postal code.
1a. The Date
The date was the easiest part as we just had to bring in a text box for the user and connect it to a formula tool before the API download began.
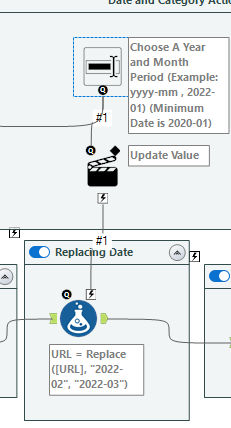
As you can see in the image above instructions were given on how to input the date as well as the minimum date they could successfully input without the API breaking. The action tool below the text input box was specifically targeting the replace field within a replace formula so that the target value (the initial date) would be switched out.
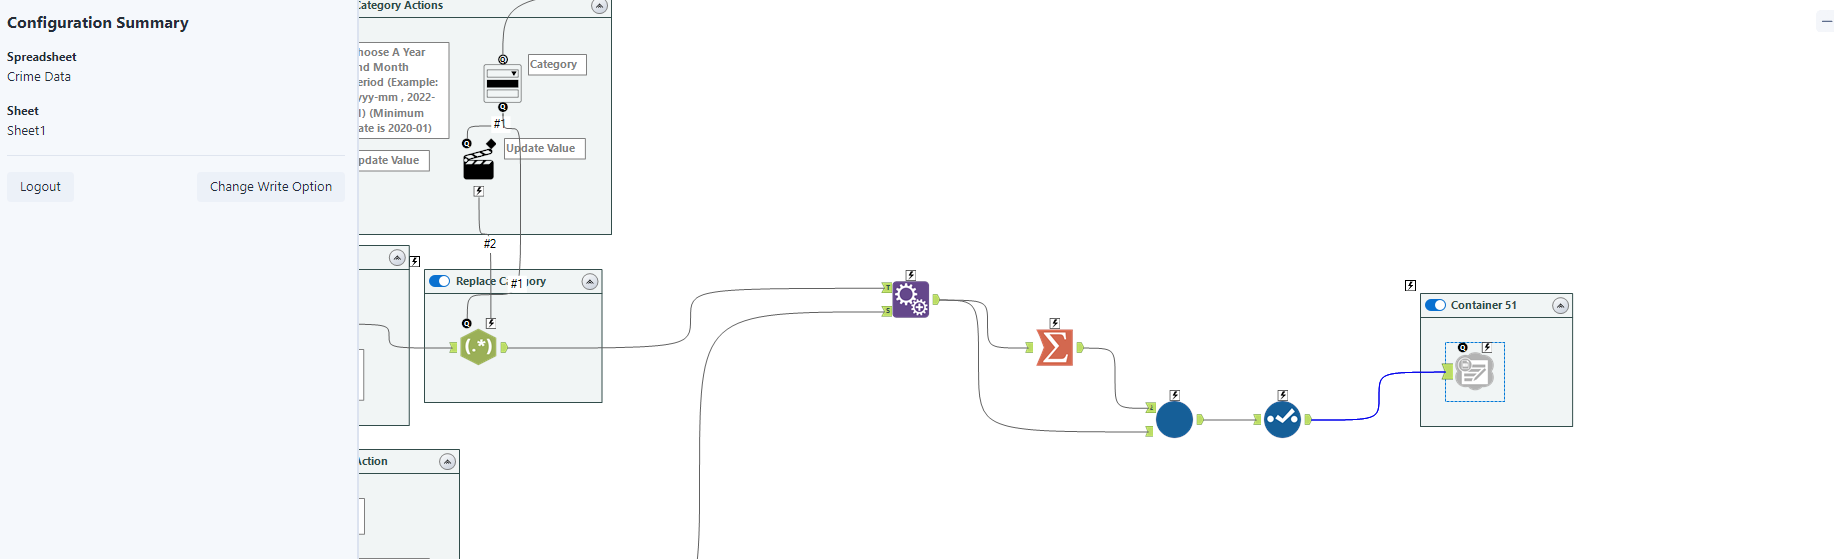
2a. The Category
Replacing the category took a little more work because I decided to pull the categories using another API from the same website. At the same time I wanted categories from the same month which I why you'll see the date text input informing the category API as well as the date in the regular API in the image below.
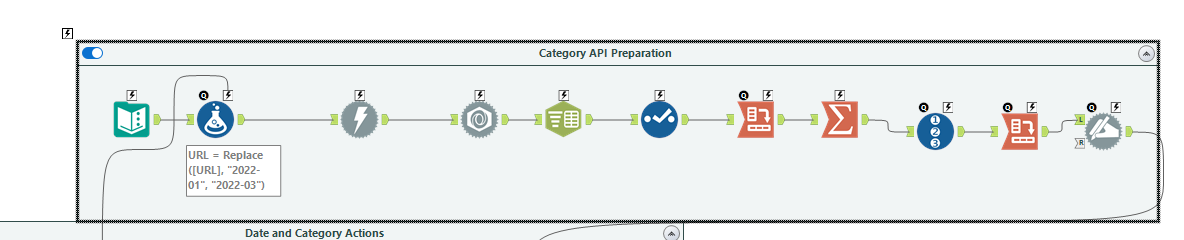
After restructuring and preparing the data from the API I also had to dynamically rename the columns to make each one a category name. This is done because when you give the user a dropdown tool to choose a list of items the tool can only look at column names. The output from the dynamic rename tool on the far left was connected to a dropdown tool and that was connected to a regex replace tool using an action tool. Within the regex replace we were switching out the category part of the API with the chosen category.
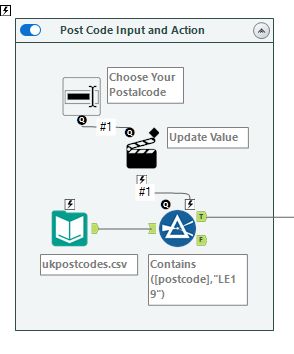
3a. The Postal Code
This was the most interesting to set up as there was no defined postal code within the API, but rather a latitude and longitude. First I had to bring in a huge list of UK postal codes and their corresponding latitudes and longitudes. Once I had them I put in a text input and action tool so that the user could define the postal code they wanted. This would've been easy if the user just inputted a well-defined six-digit postal code, but our coach wanted to be able to input just the first three digits, which would return at times thousands of postal codes.
The only way to test a bunch of different postal codes with different coordinates was to pull a bunch of different APIs. I decided to do this using a batch macro. I should note that it was possible to do without a batch macro but it worked well because we had a bunch of different APIs to pull and run through the data preparation.
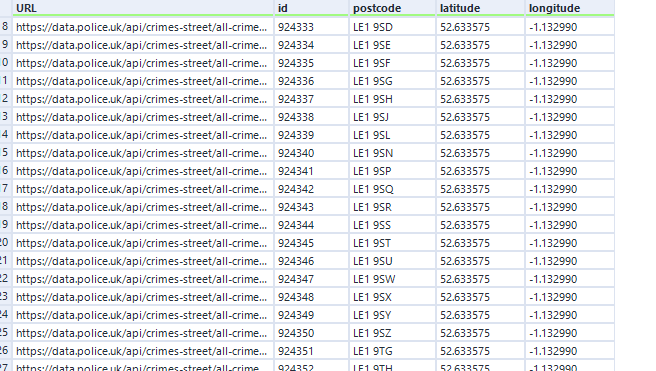
Pictured below was the output of the different postal codes before they went through the batch macro. The URLs themselves had a lat and long that needed to be replaced with the lat and long columns.
Here is the batch macro that took each row level of data and prepared it:
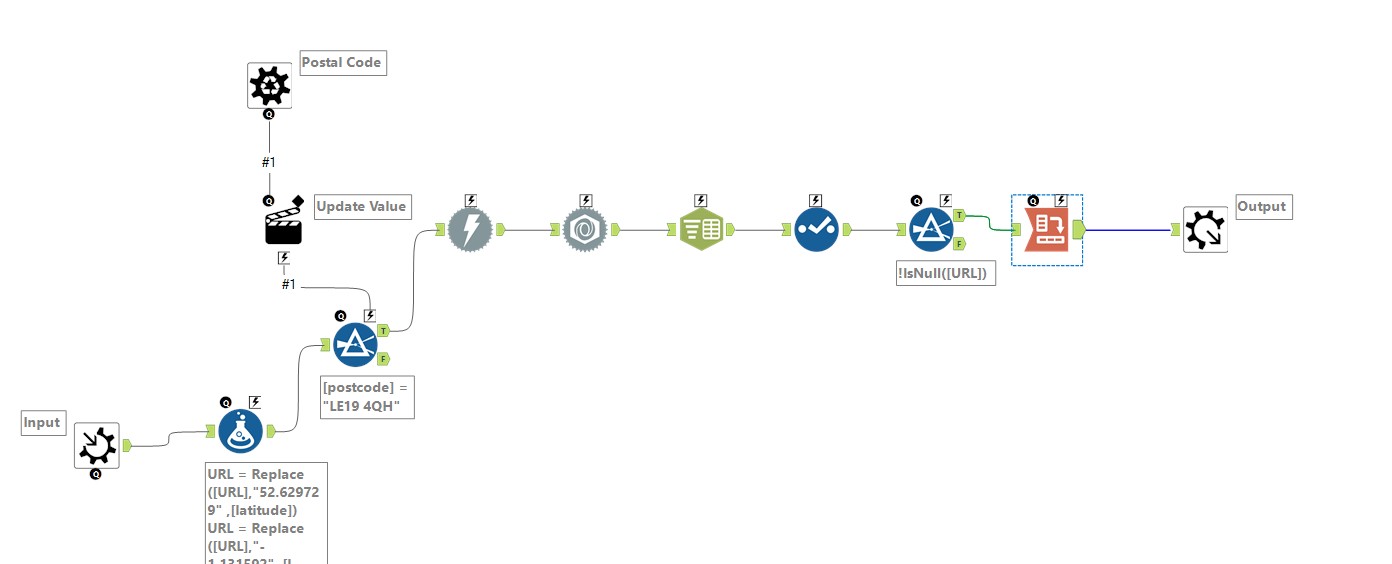
Essentially we are taking the data in one row at a time and replacing the lat and long within the URL with the lat and long columns. The data would have been unioned together at the end and is nearly ready for visualization.
The final step was to send the data somewhere that could be consistently updated. This was new to me but there was a couple ways to approach this. I decided on downloading the Google Sheets Output Tool, which allows you to send your output to a defined google sheet.
From there I connected to Google Drive in Tableau and chose the sheet I wanted it to pull the data from. The data prep was all done and I made the dashboard:

Day 3 was done. 2 more to go....

Have a great week and reach out if you have any questions :)