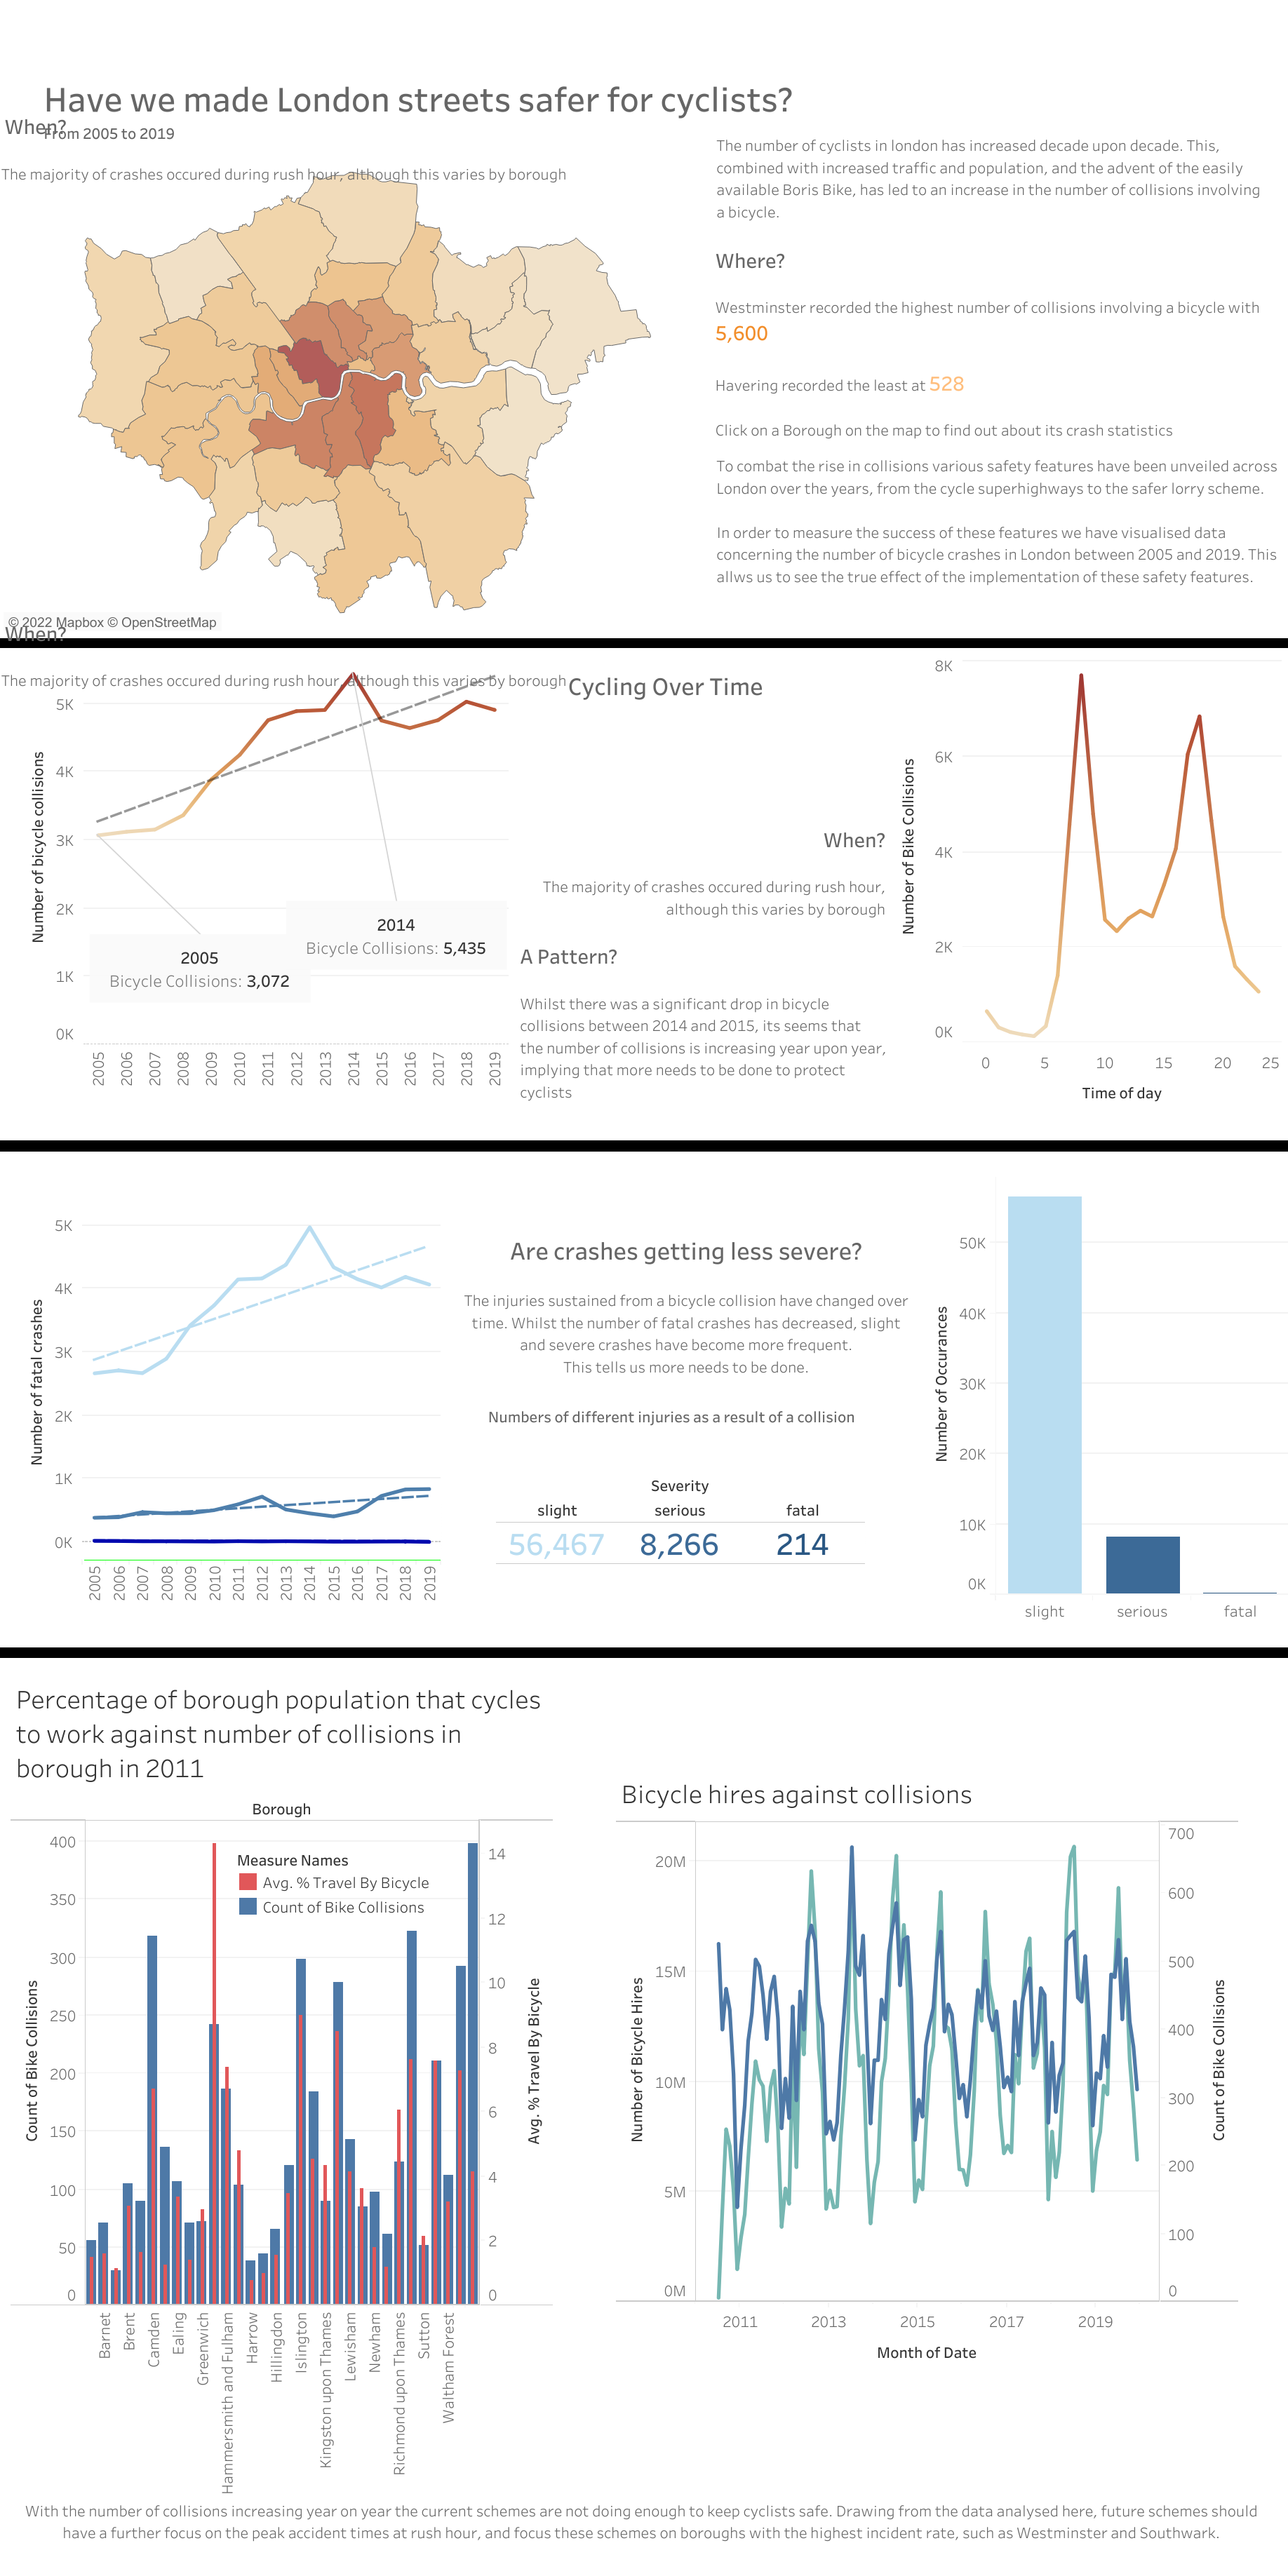
Week 1 ended with DS31 remaking our original application dashboard using skills learned during the first week. Returning to the original dashboard data was a bit of a shock, and trying to decipher what I had done two months ago even more. Using Alteryx I had a go at cleaning a nightmare dataset from TFL, but then decided on two easier datasets to fix.

Using Tableau Prep and Alteryx I was able to incorporate new data into my original dashboard. This allowed me to plot all bicycle collisions in London between 2010 and 2019 against both cycle hires each day and the proportion of the population in each borough that cycles. This showed an interesting pattern in that the collision statistics closely matched the bicycle hire data, and that boroughs that have a higher proportion of cycling residents tended to have more crashed (although this was less reliable).
