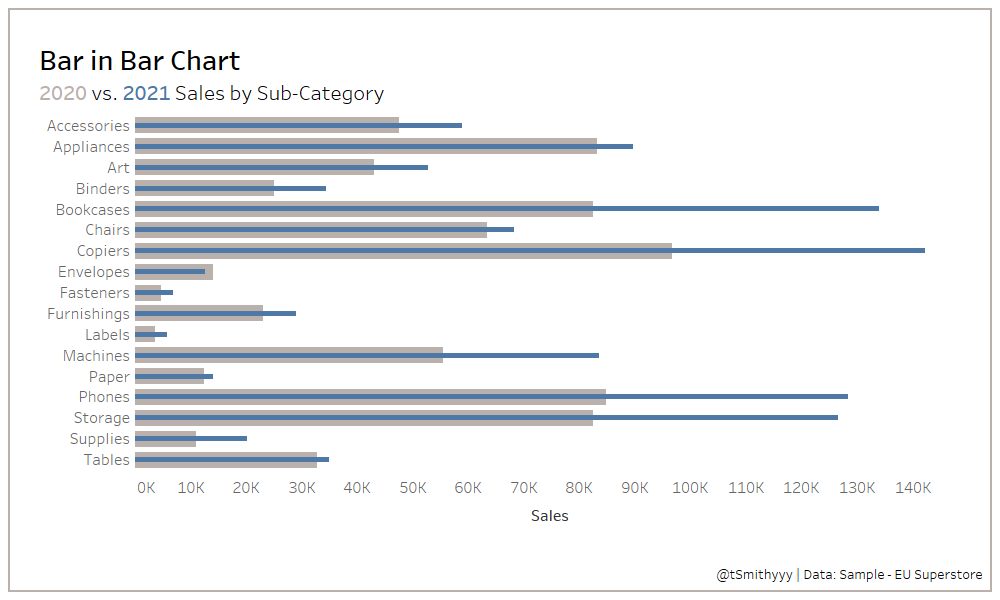
Last week, DS27 were taken back to Tableau basics as we built over 40 charts in a day using Sample - EU Superstore data. One chart that we were told could come in particularly handy when on placements was a bar in bar chart, which can be used to make comparisons between two measures. As such, I have decided to put a mini tutorial together on how to make the chart in Tableau.
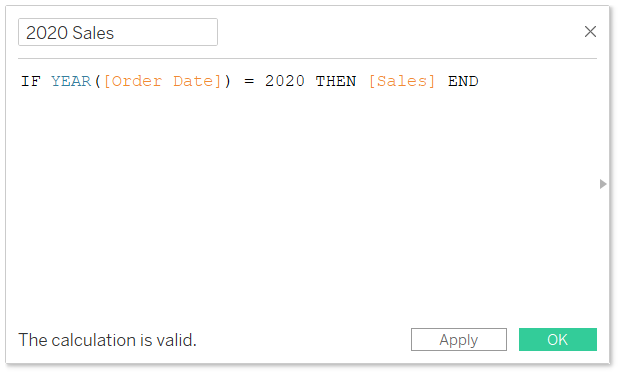
Step 1: Before getting started, we need to create a couple of calculated fields to get the measures for comparison. In this example, I am looking at 2020 sales and 2021 sales for different product sub-categories. To extract 2020 sales, I used the below syntax...
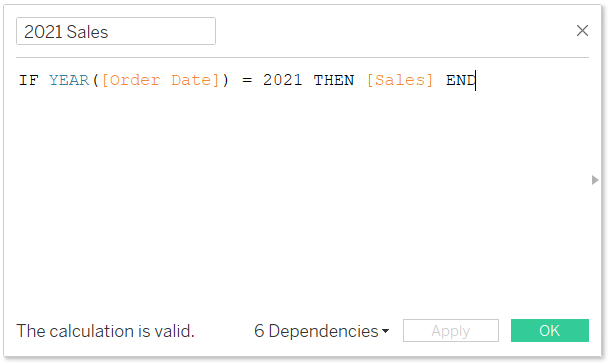
This new measure can then be duplicated and edited to extract 2021 sales.
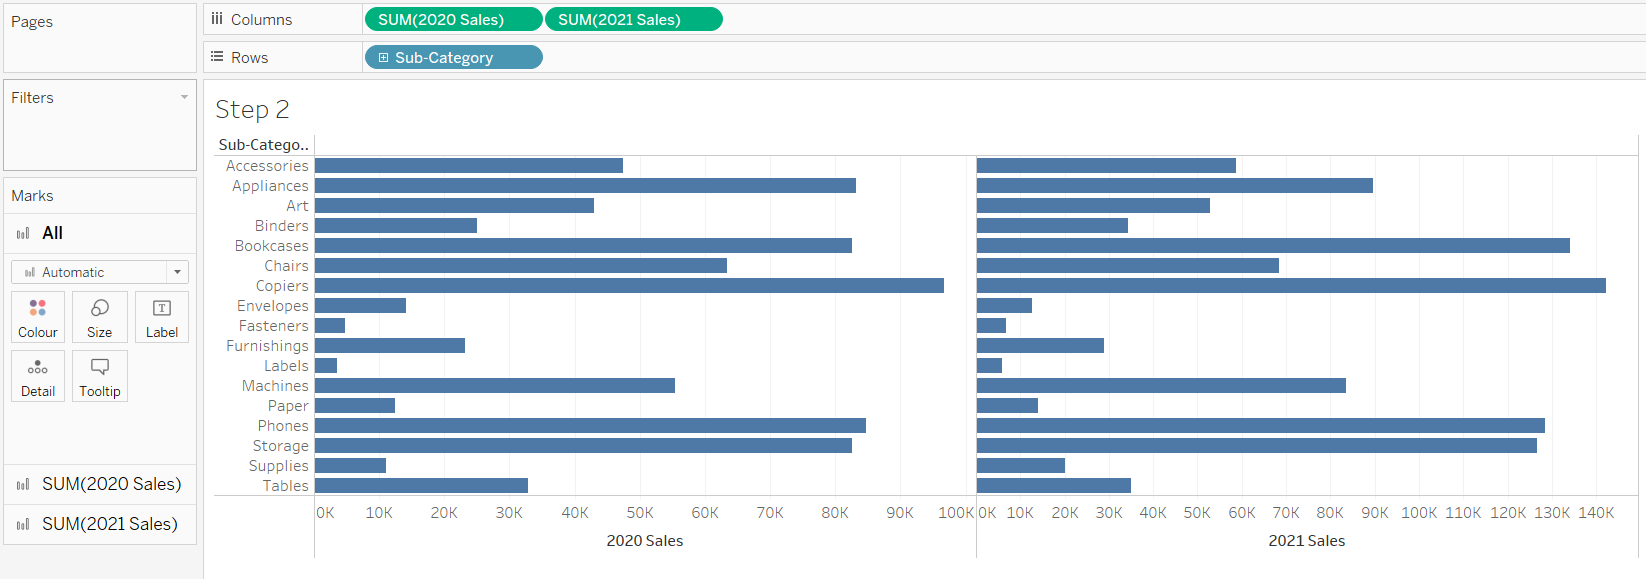
Step 2: Drag Sub-Category onto Rows and the new 2020 Sales and 2021 Sales measures onto Columns.
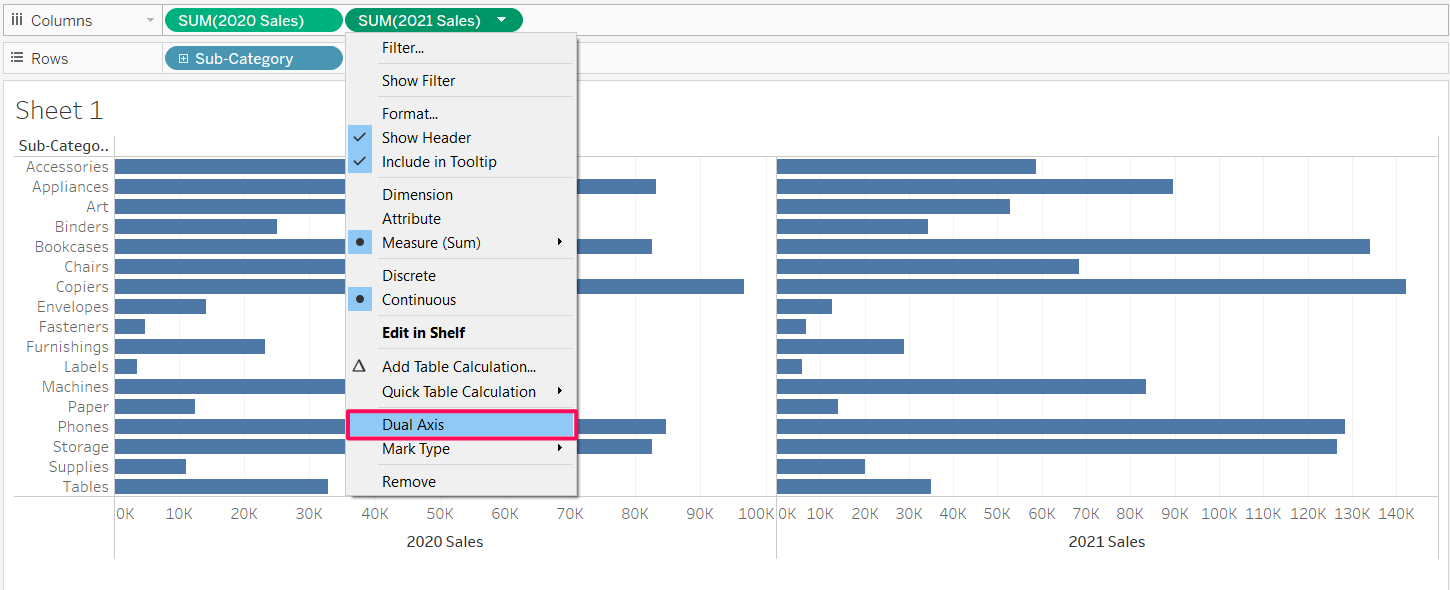
Step 3: From here, we need to make a dual axis to lay the data on top of each other. To do this, click on the carrot (arrow) that appears when hovering over 2021 sales, or simply right click, and select dual axis.
Here, a Measure Names field will be created that gives each measure a different colour. Before moving forward, make sure to synchronise the axes.
Step 4: Note that Tableau may automatically change each mark to a circle. To get our bars, go to the All marks card and use the dropdown to select Bar.
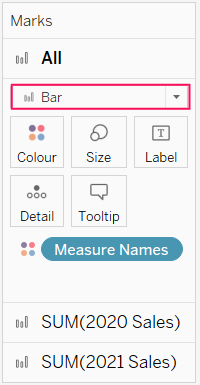
Step 5: On the SUM(2021 Sales) marks card, reduce the bar size using the slider. Best practice is to always have the most recent bar as the thinner bar. That leaves us close to the chart we're looking for with some instant insight revealed.
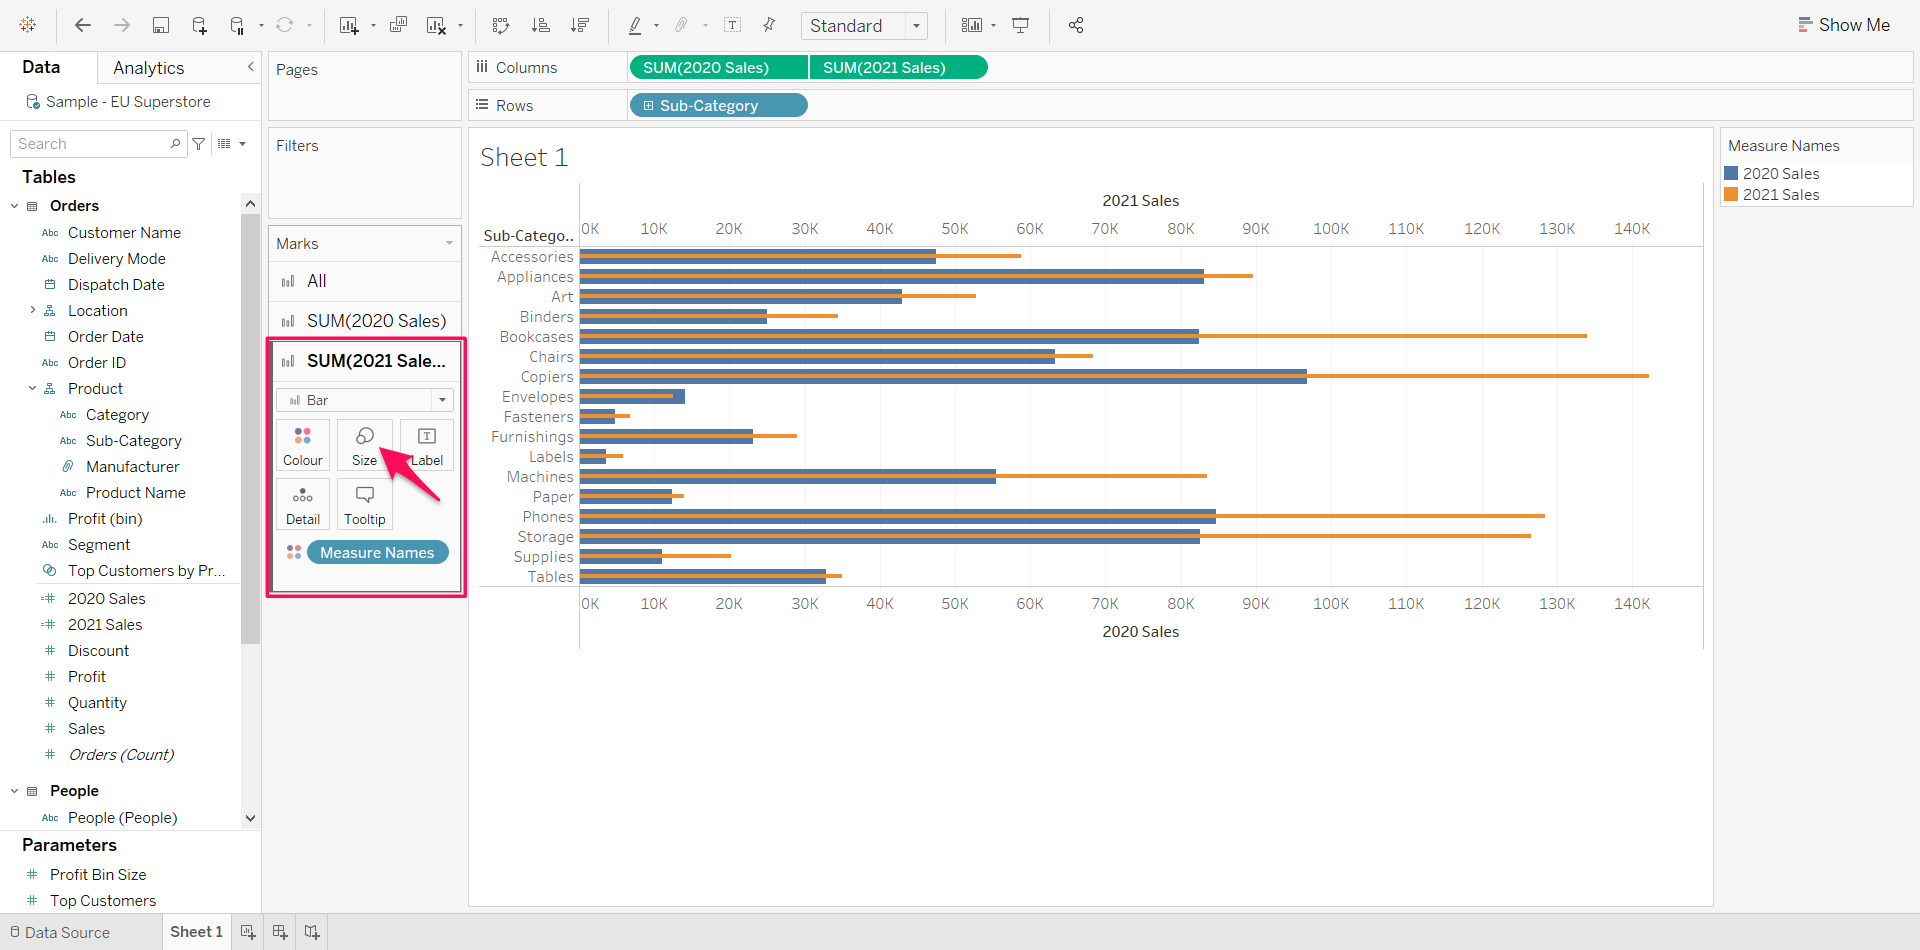
Step 6: Now for some formatting. I've changed the colours to have 2020 sales greyed out and 2021 sales in blue. Hide the top axis and field labels for rows and get rid of any gridlines and/or borders depending on what looks best for your chart. Lastly, remember to update the remaining axis title according to your data and you're good to go!
Feel free to download my workbook here.
