How to display negative values as positives
I love a diverging bar chart. If you’re not aware with them then follow Andy’s blog here on how to make them. One of the nice things to do with a diverging bar chart is to label the ends of the bars so that you can remove the axis. This helps to reduce clutter, making your viz more impactful. However, if you use a negative on one of your fields to make it go to the left, then you’ll end up with negative labels, when in fact they are positives.

How can we fix this?
It’s simple.
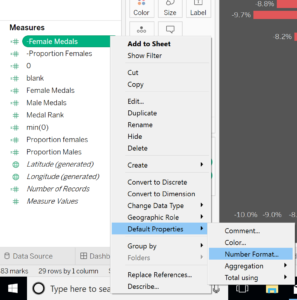
- Right click on your negative measure and click on Default Properties > Number Format :

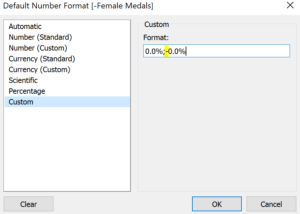
2. Set up your number format to however you want to see them displayed – here I am using a percentage with one decimal place. Don’t click on OK yet though – there’s one more step.
3. Click on ‘Custom’ – You will notice a semi-colon (;) and a value either side. What this means is for positive values display in the format to the left, and for negative values use the format on the right. Simply remove the – before the value after the semi-colon. Now your negative values will not display the – prefix before them – so they will appear as positive values despite actually being negative.

That’s it – Well done. You’ve displayed negative values as a positive.
Any comments or questions feel free to reach out to me on twitter or linkedin.
