When building reports on Power BI we usually want to add slicers that allow the user to filter charts and unlock new insights or visualise emerging patterns or trends. However, when a report is built upon the popular star schema data model it is possible that a slicer may give the user the option to filter charts for values for which there are no data. In Tableau it is good practice to edit filters to "Show only relevant values" to ensure that the user is removed of the possibility of filtering for a combination of values that would result in a blank dashboard. We can replicate this functionality in Power BI with a couple more steps.
The Data

We will use sales data from a fictional cycling clothing shop as an example. The data model uses the popular star schema method, consisting of a fact table containing the sales data and two related look-up tables containing information on customers and products. It should be noted that the two look-up tables are unrelated as they are directly related to each other, but are via the fact table.
The Problem
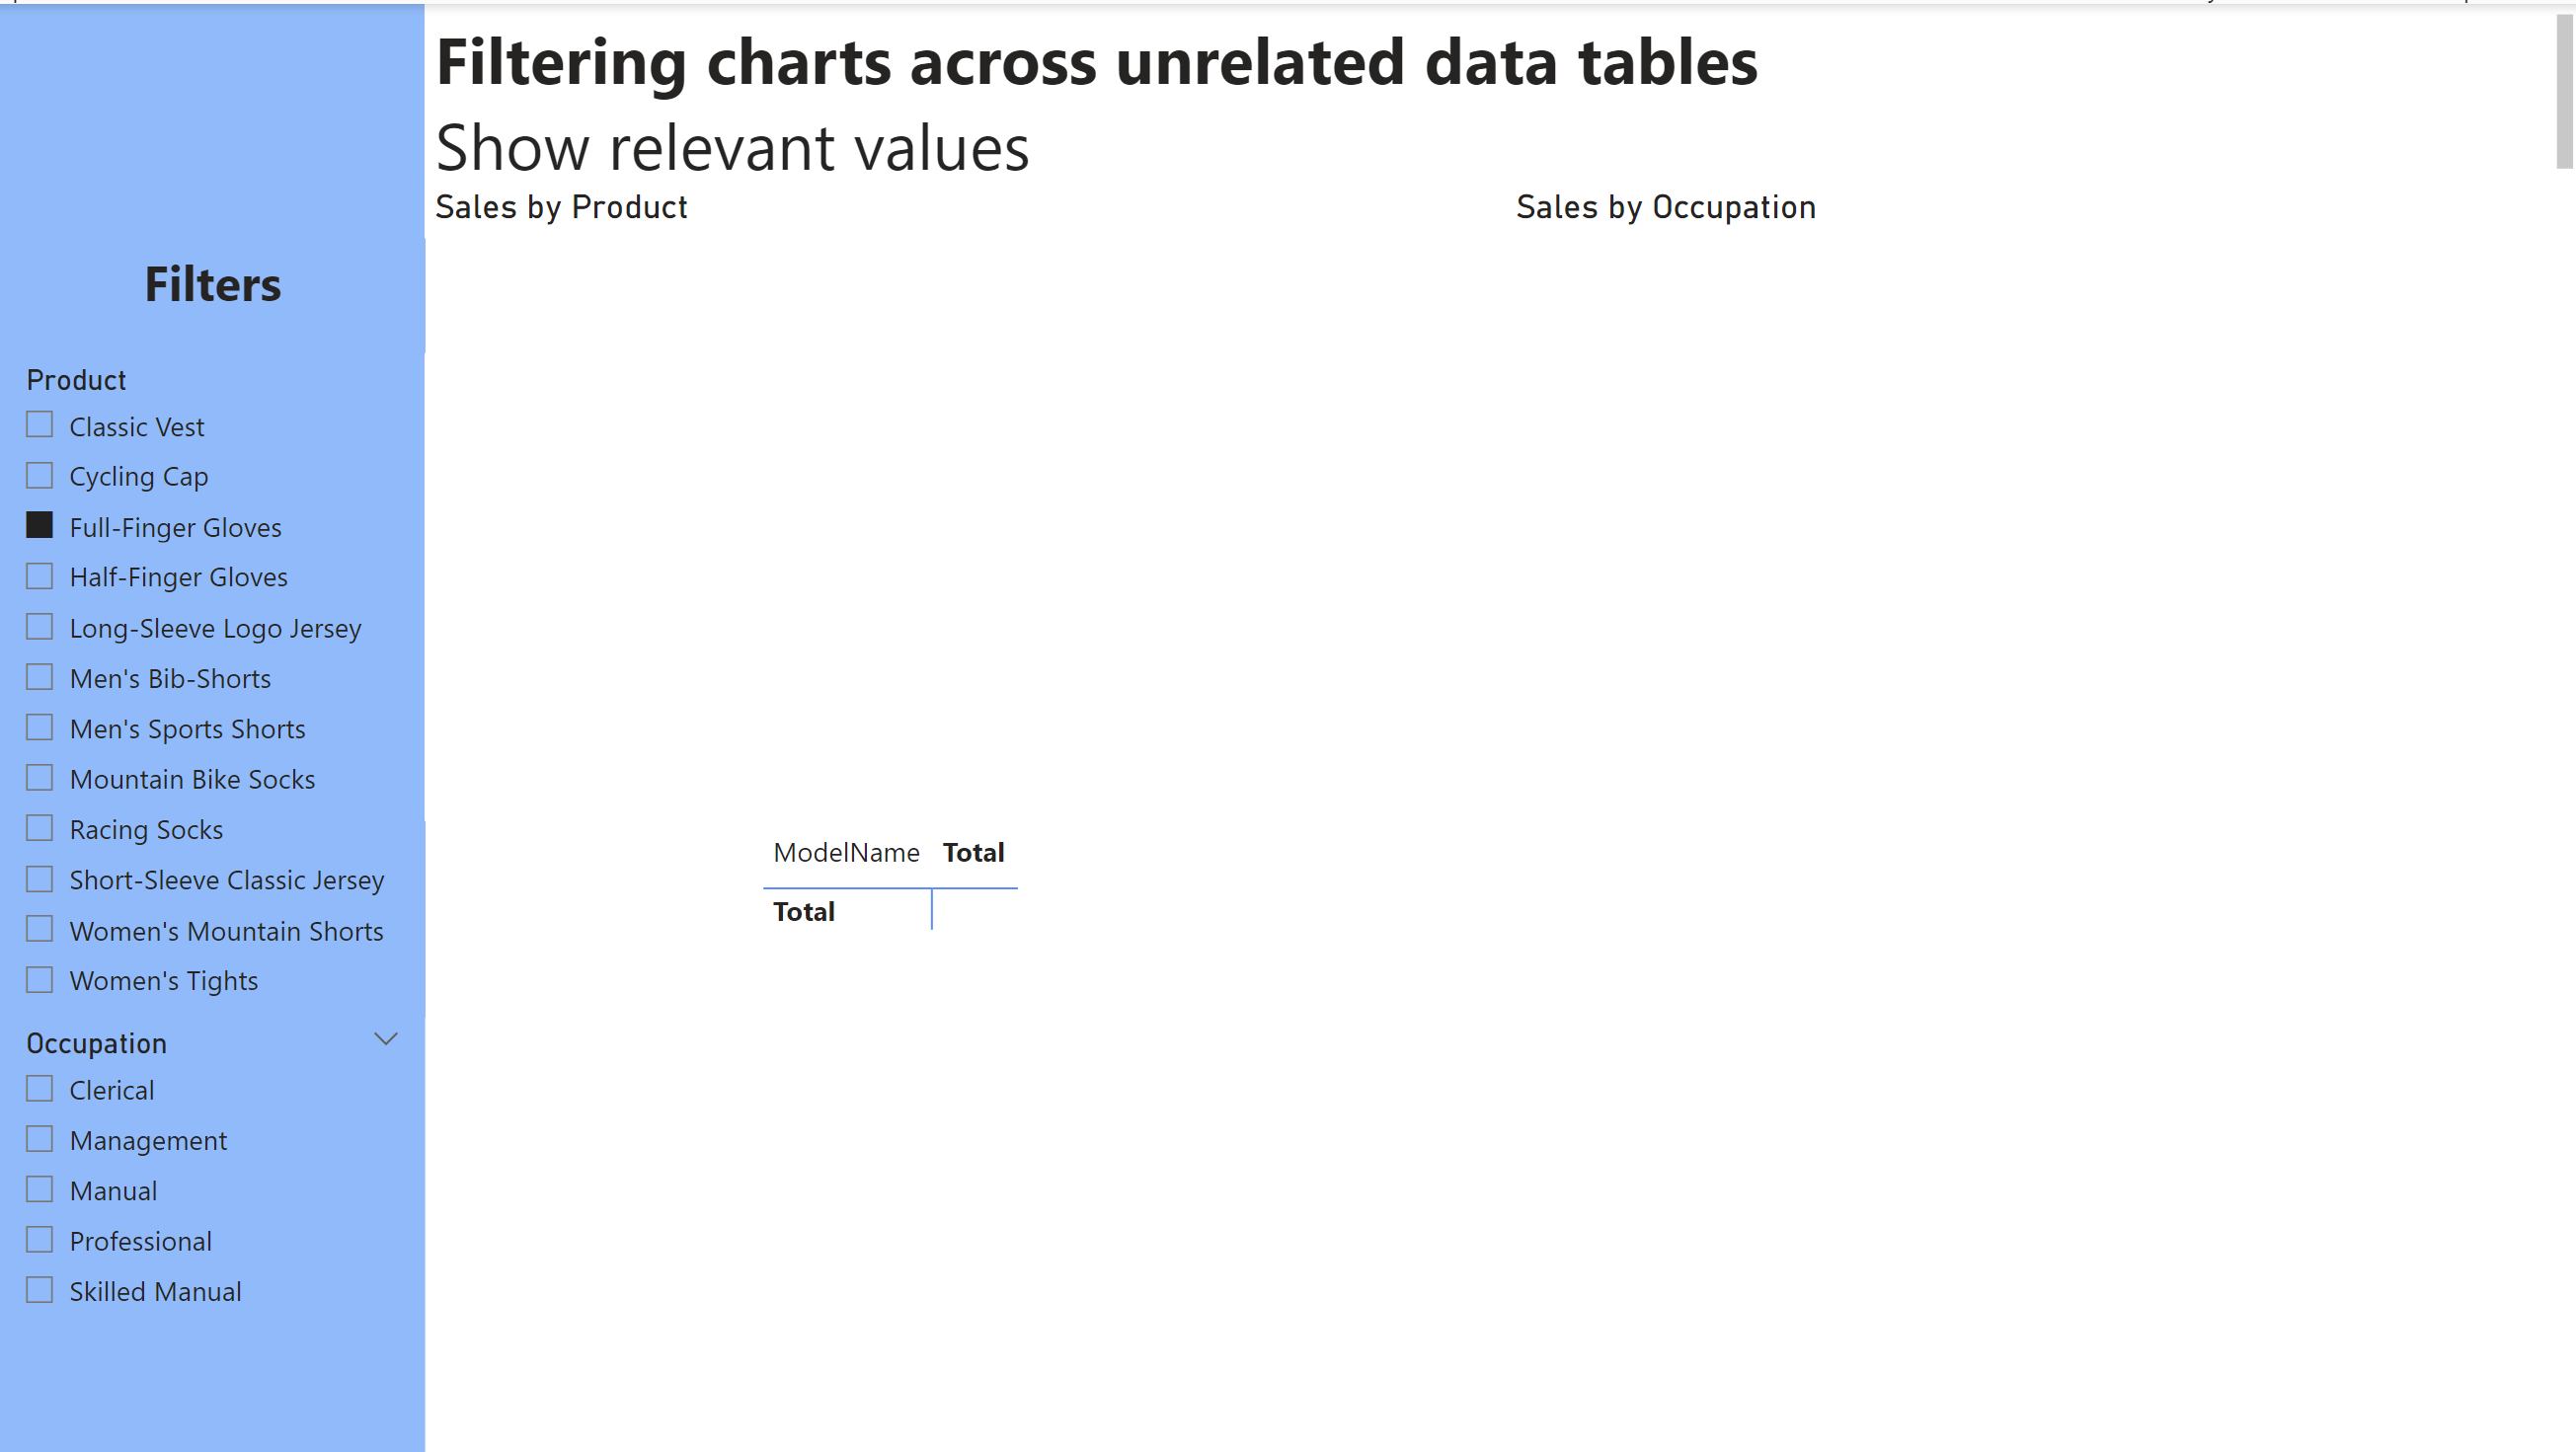
We want to build a report to analyse sales performance. When doing so we add slicers to the dashboard to give the user the ability to interrogate the data and gain insights. However, within the slicers is the option to filter the dashboard for values for which we have no data (i.e., we have not made any sales).

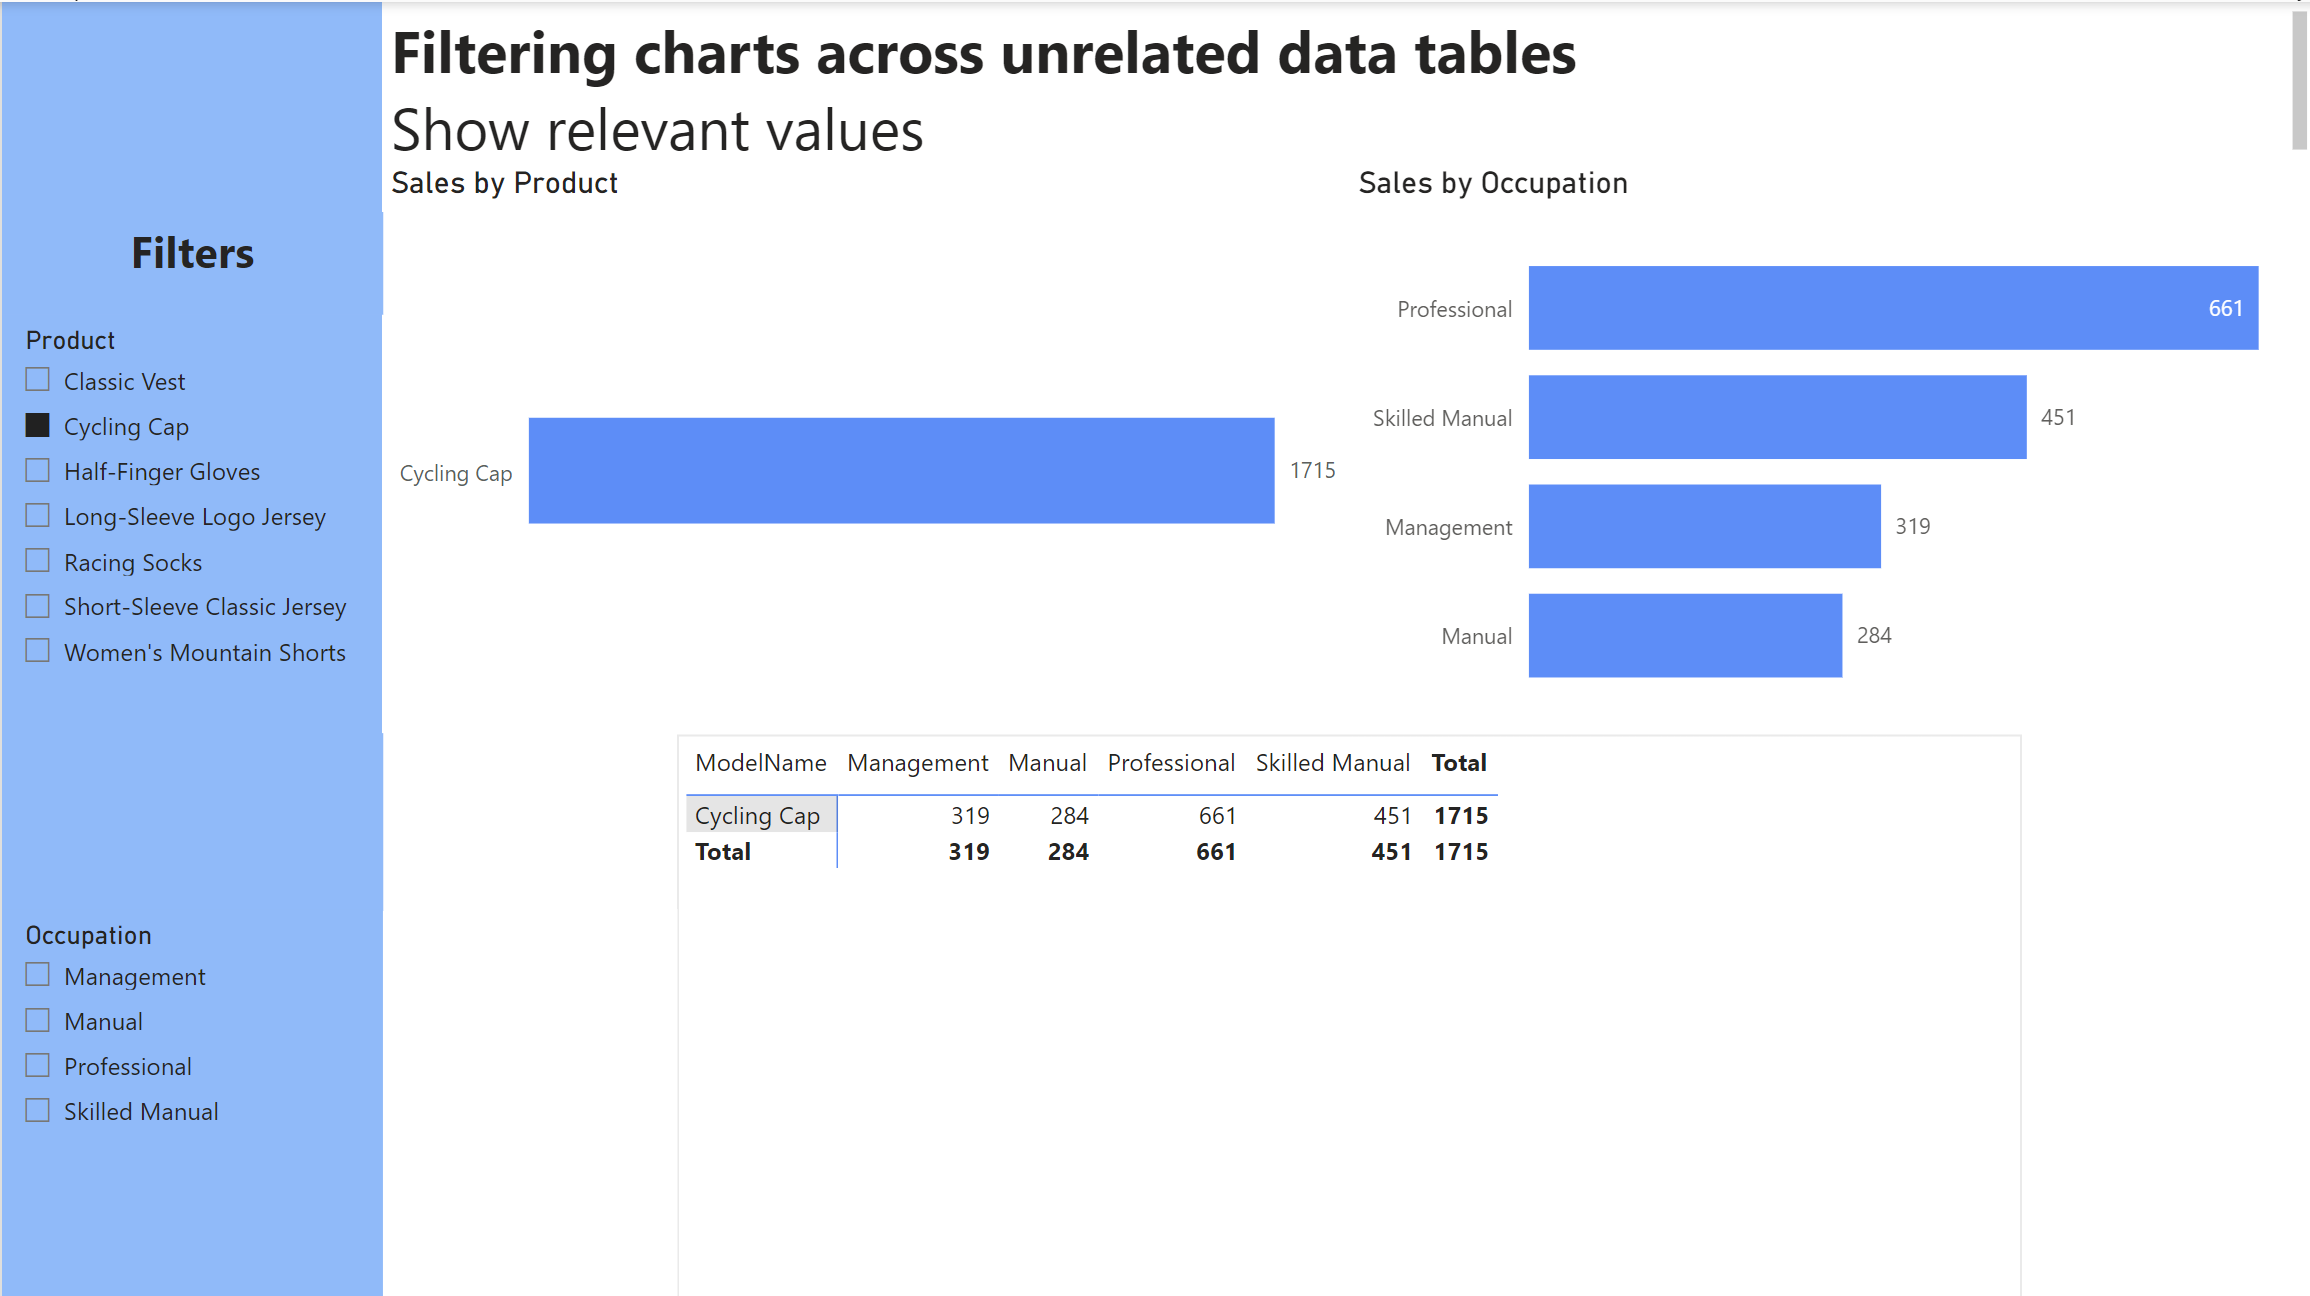
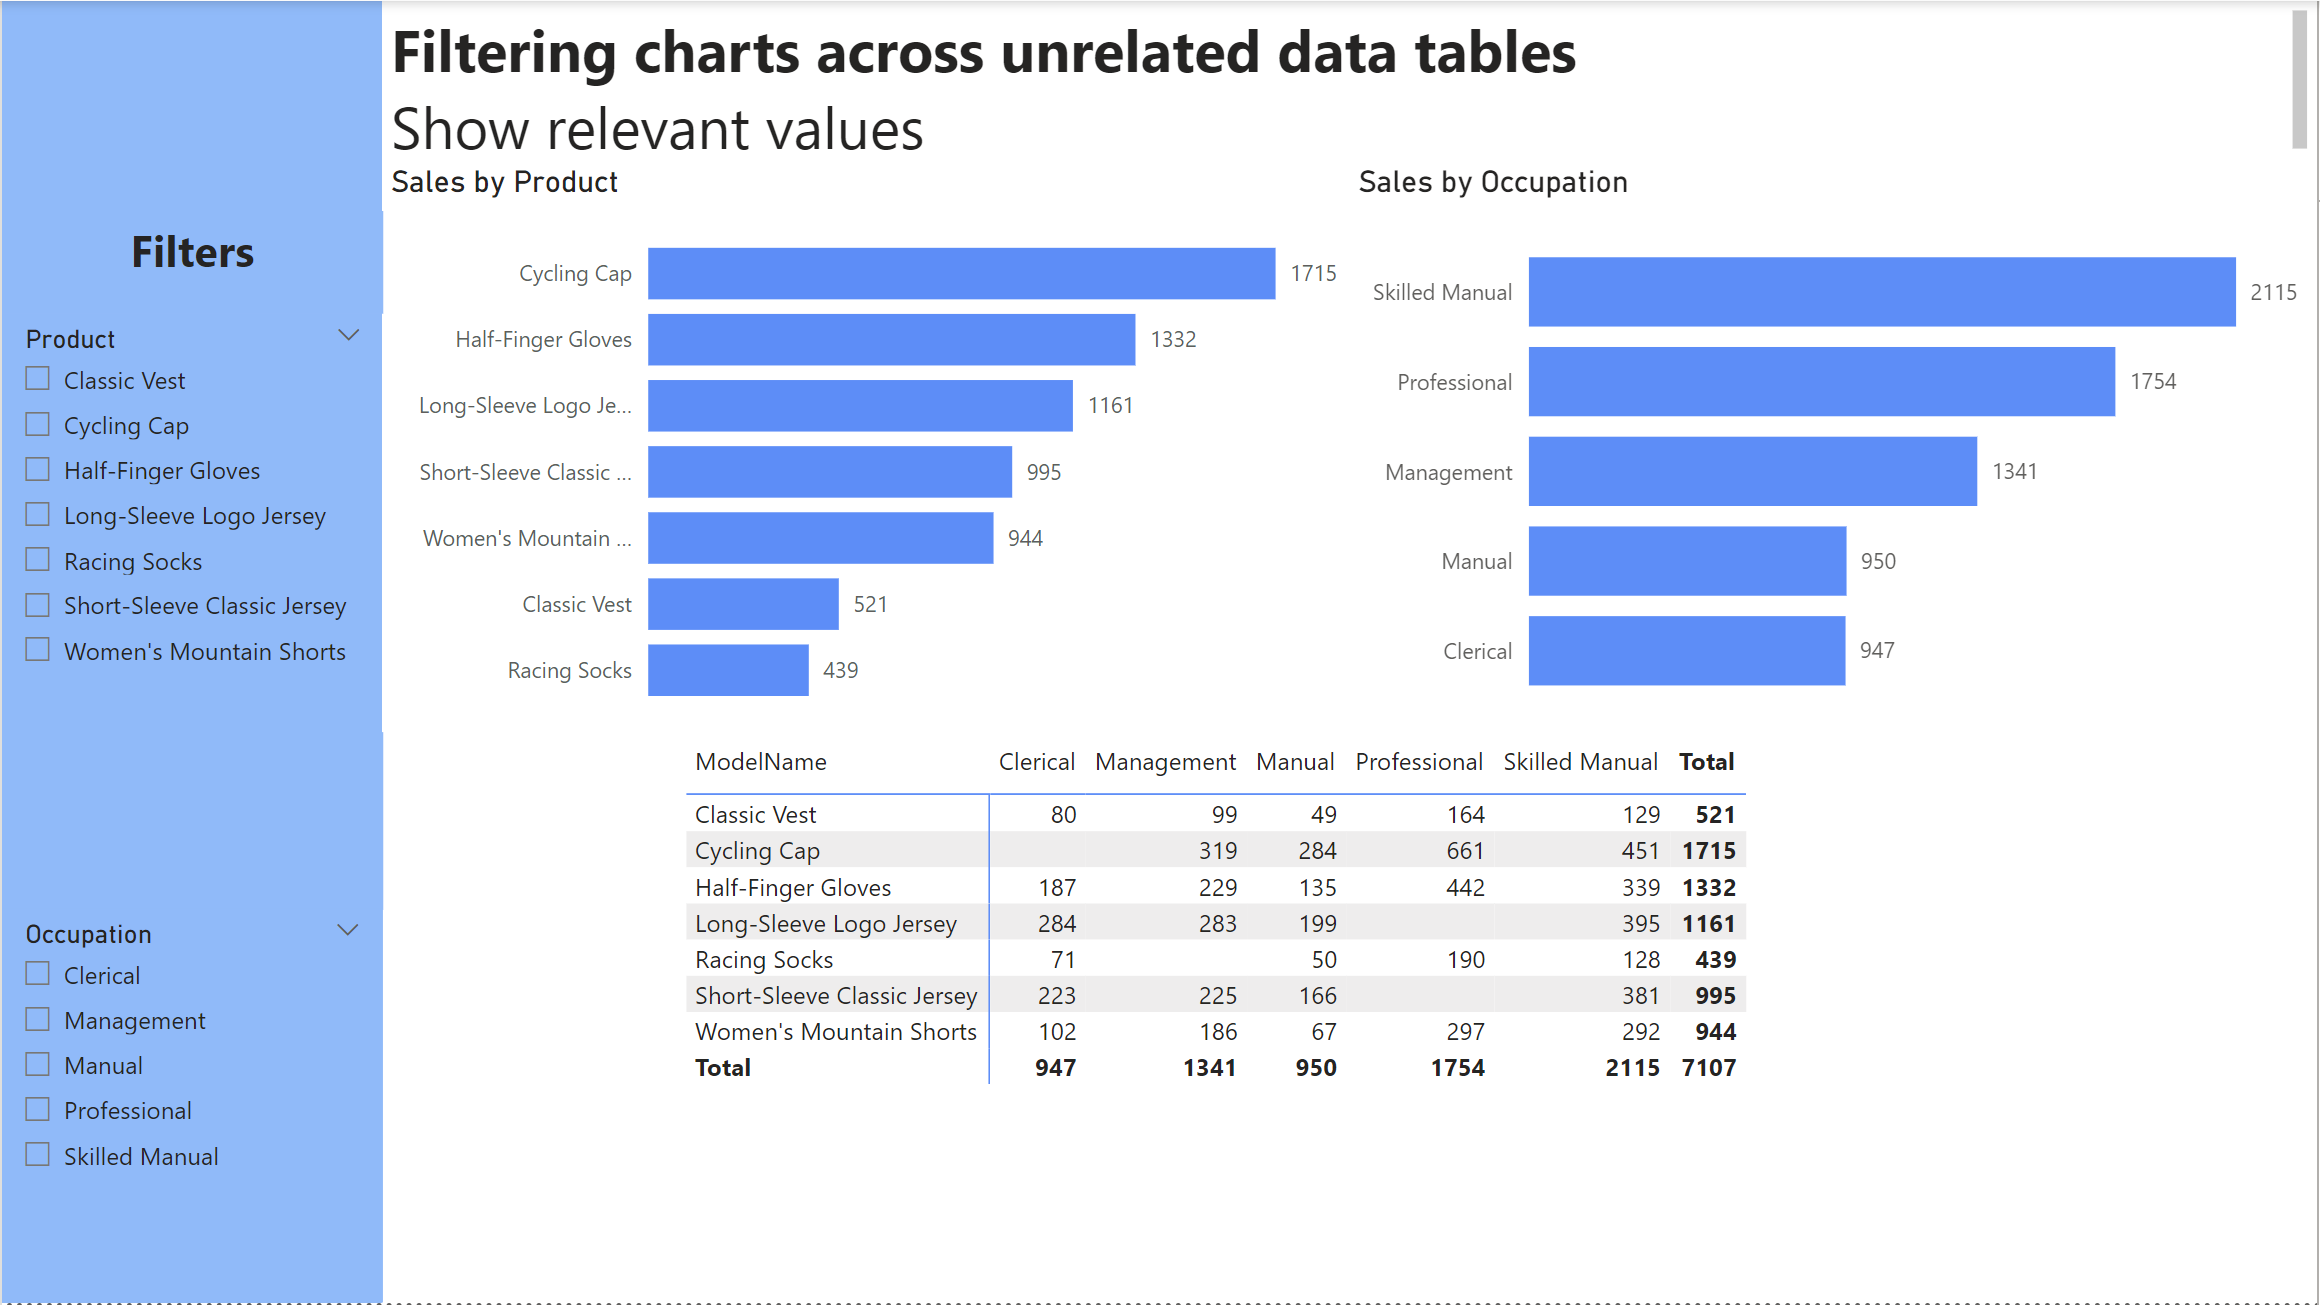
In our Product slicer we have the option to select from 12 products, yet when we plot sales by product we only see 7 bars. This tells us that we have 5 products in our product lookup table for which we have no records in our sales fact table. If we select one of these redundant values, we end up with a blank dashboard which is a waste of time and not user-friendly.
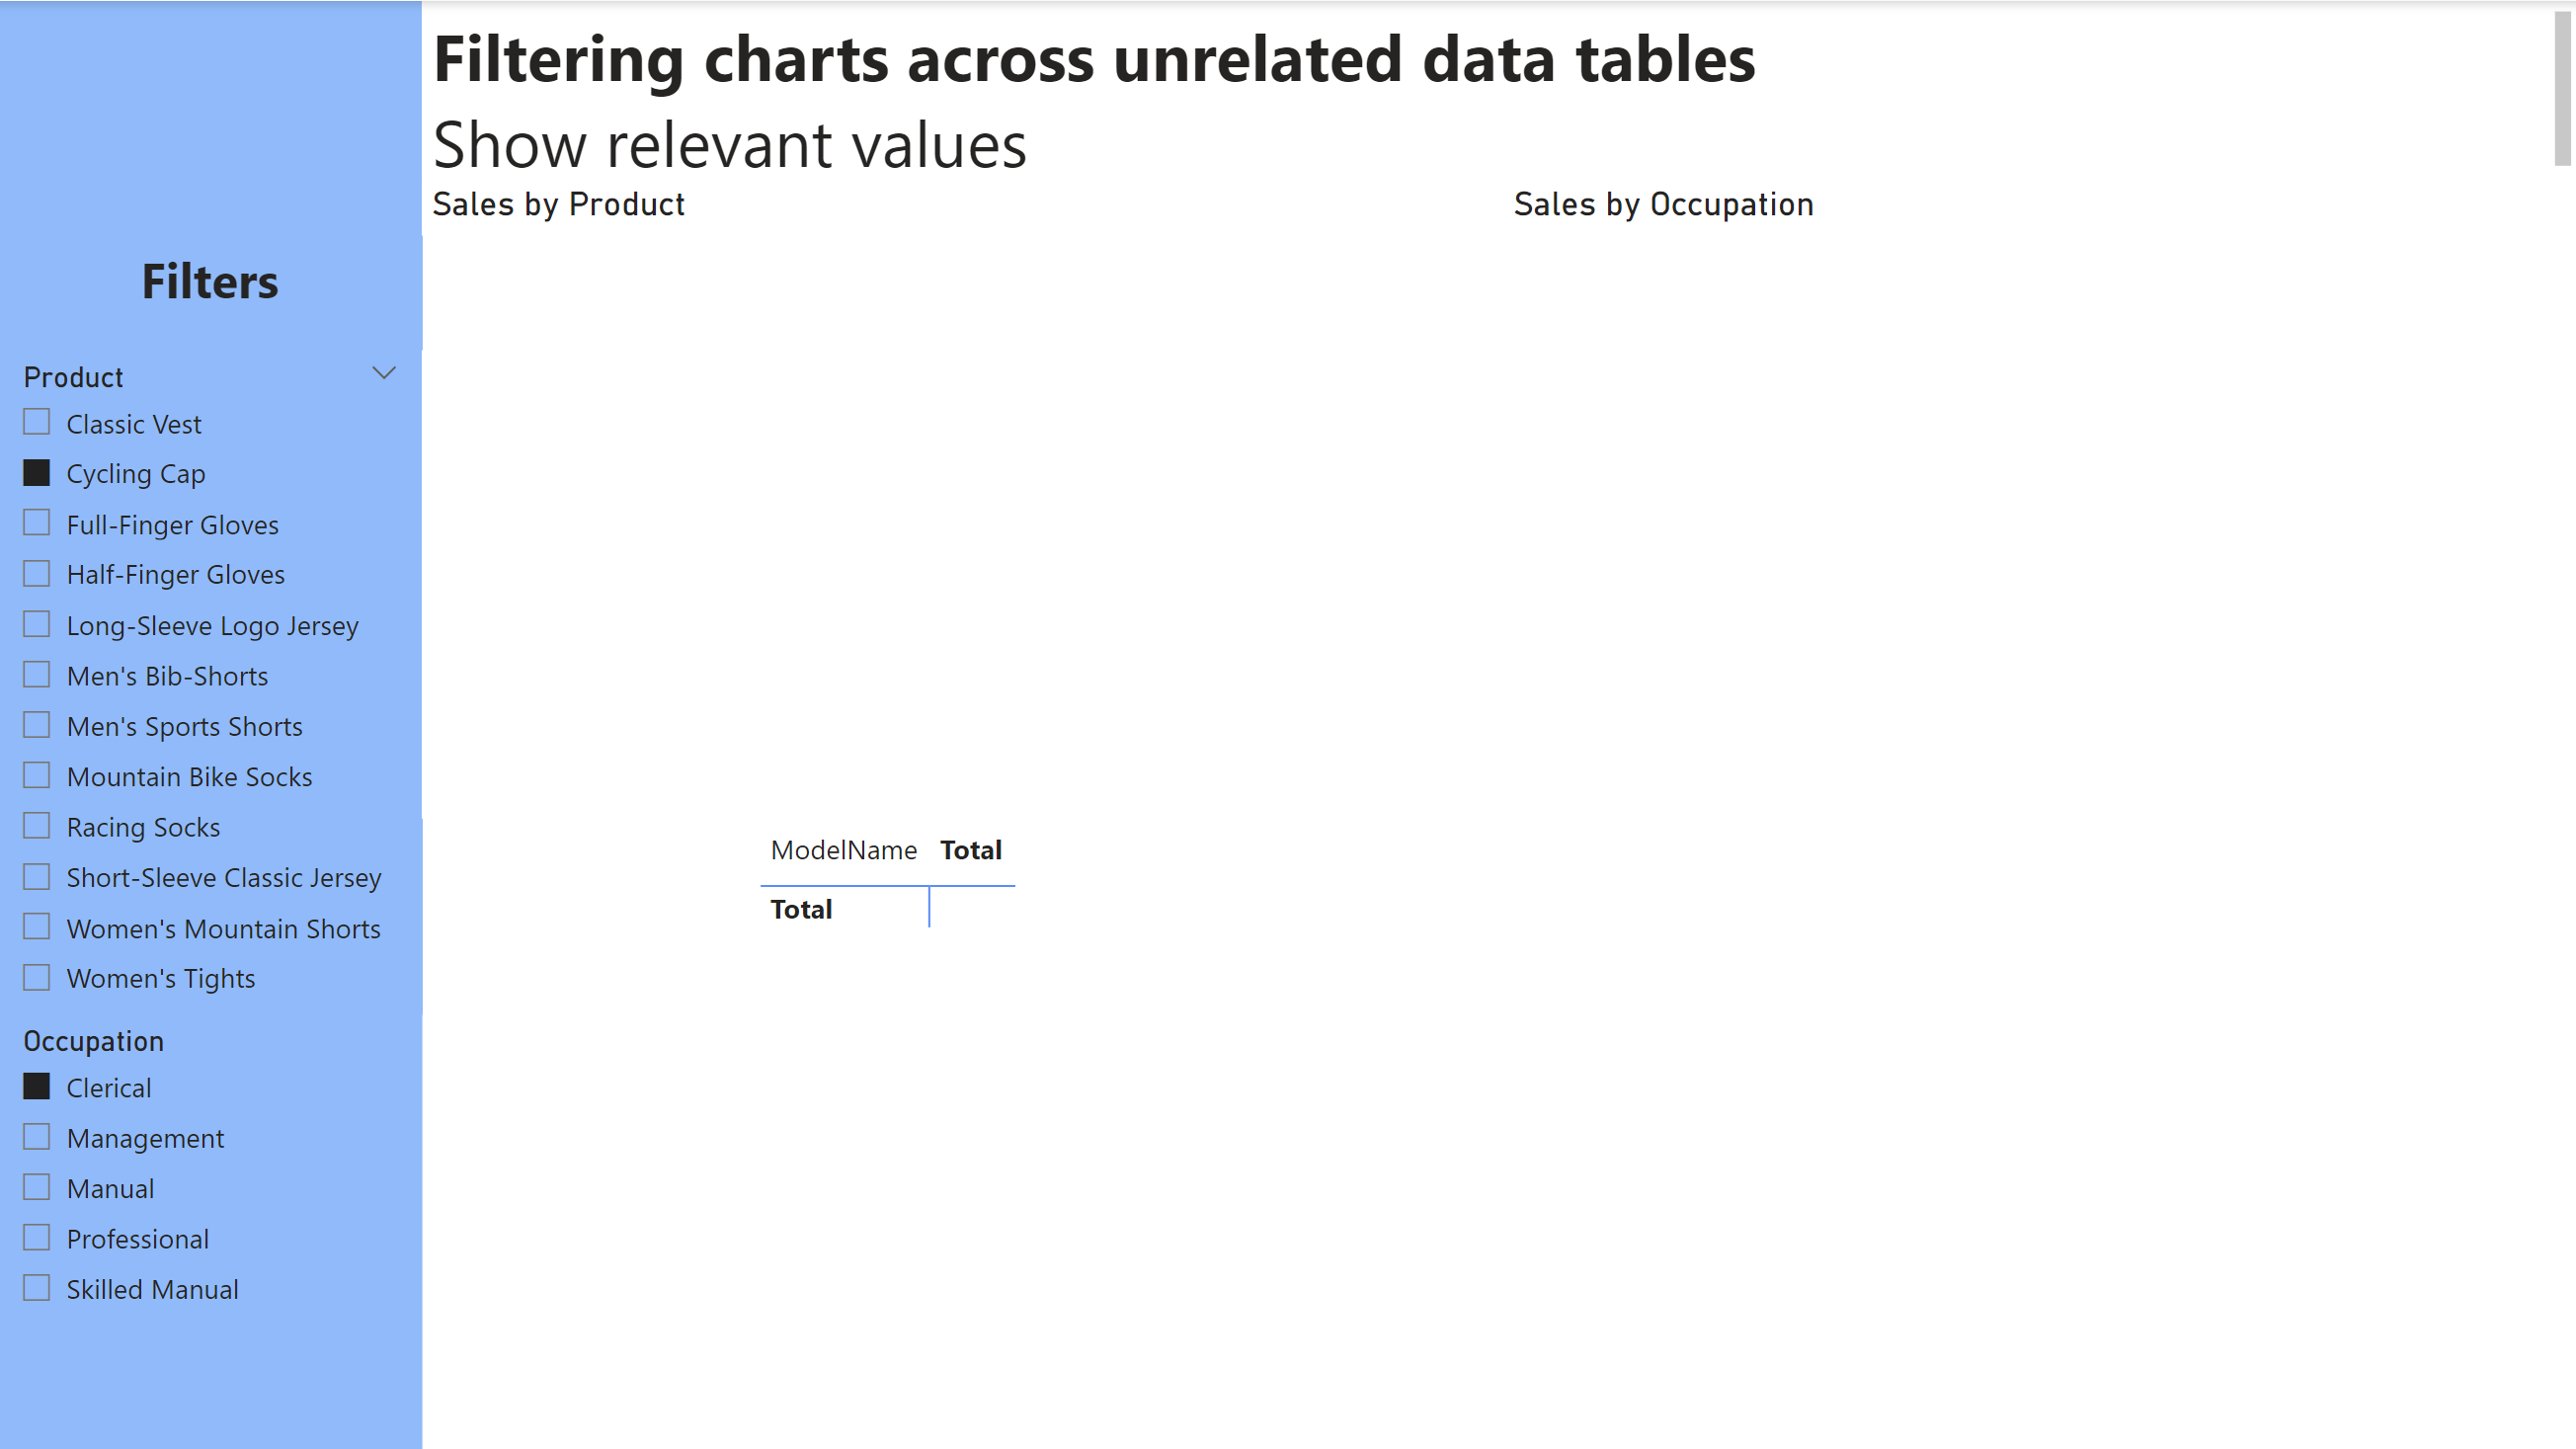
The matrix breaks up the sales data by product and by occupation, fields from each unrelated lookup table. We can see that we have a number of gaps, which indicates that have not sold certain products to certain occupations (i.e., no records in the sales table). However, if we were to filter for Cycling Cap we would still be able to filter for Clerical, despite the fact that are no relevant values and leading us to another blank dashboard.
To fix this, we need to create the following measure and apply it as a filter to our slicers.
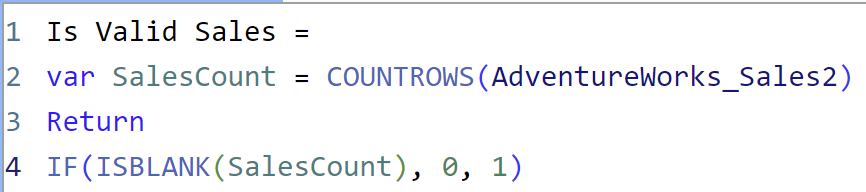
Here we are simply counting the rows of the sales fact table, and returning 0 if there are no rows and 1 of there is more than one.
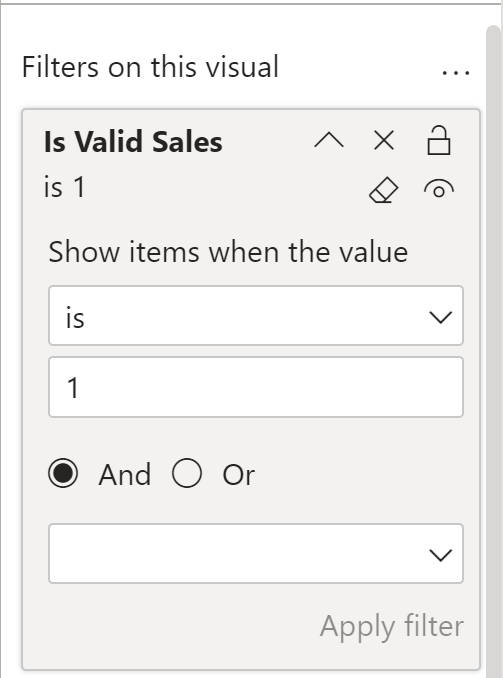
By selecting each slicer and applying the new measure as a filter with the above configuration, we then see that the product slicer now only gives the user the option to filter for values that have data.
We also no longer have the possibility of filtering for a combination of values that have no existing records. E.G., when selecting Cycling Cap in the product slicer we do not have the option to filter for Clerical in the occupation slicer.