Today's task centred around using the balldontlie API which contained extensive amounts of data on the NBA, as a fan of sports analytics I was excited!
I decided to focus on Lebron James and his second spell at the Cleveland Cavaliers (2014-2018). Knowing this, I altered my API call to just return Lebron's game-by-game stats for this timespan. My Alteryx workflow looks like this:


The text input contains 4 separate calls differentatiated by the season. I then downloaded and parsed the data into a table format as usual, followed by some general cleaning to make my time in Tableau building the dashboard easier.
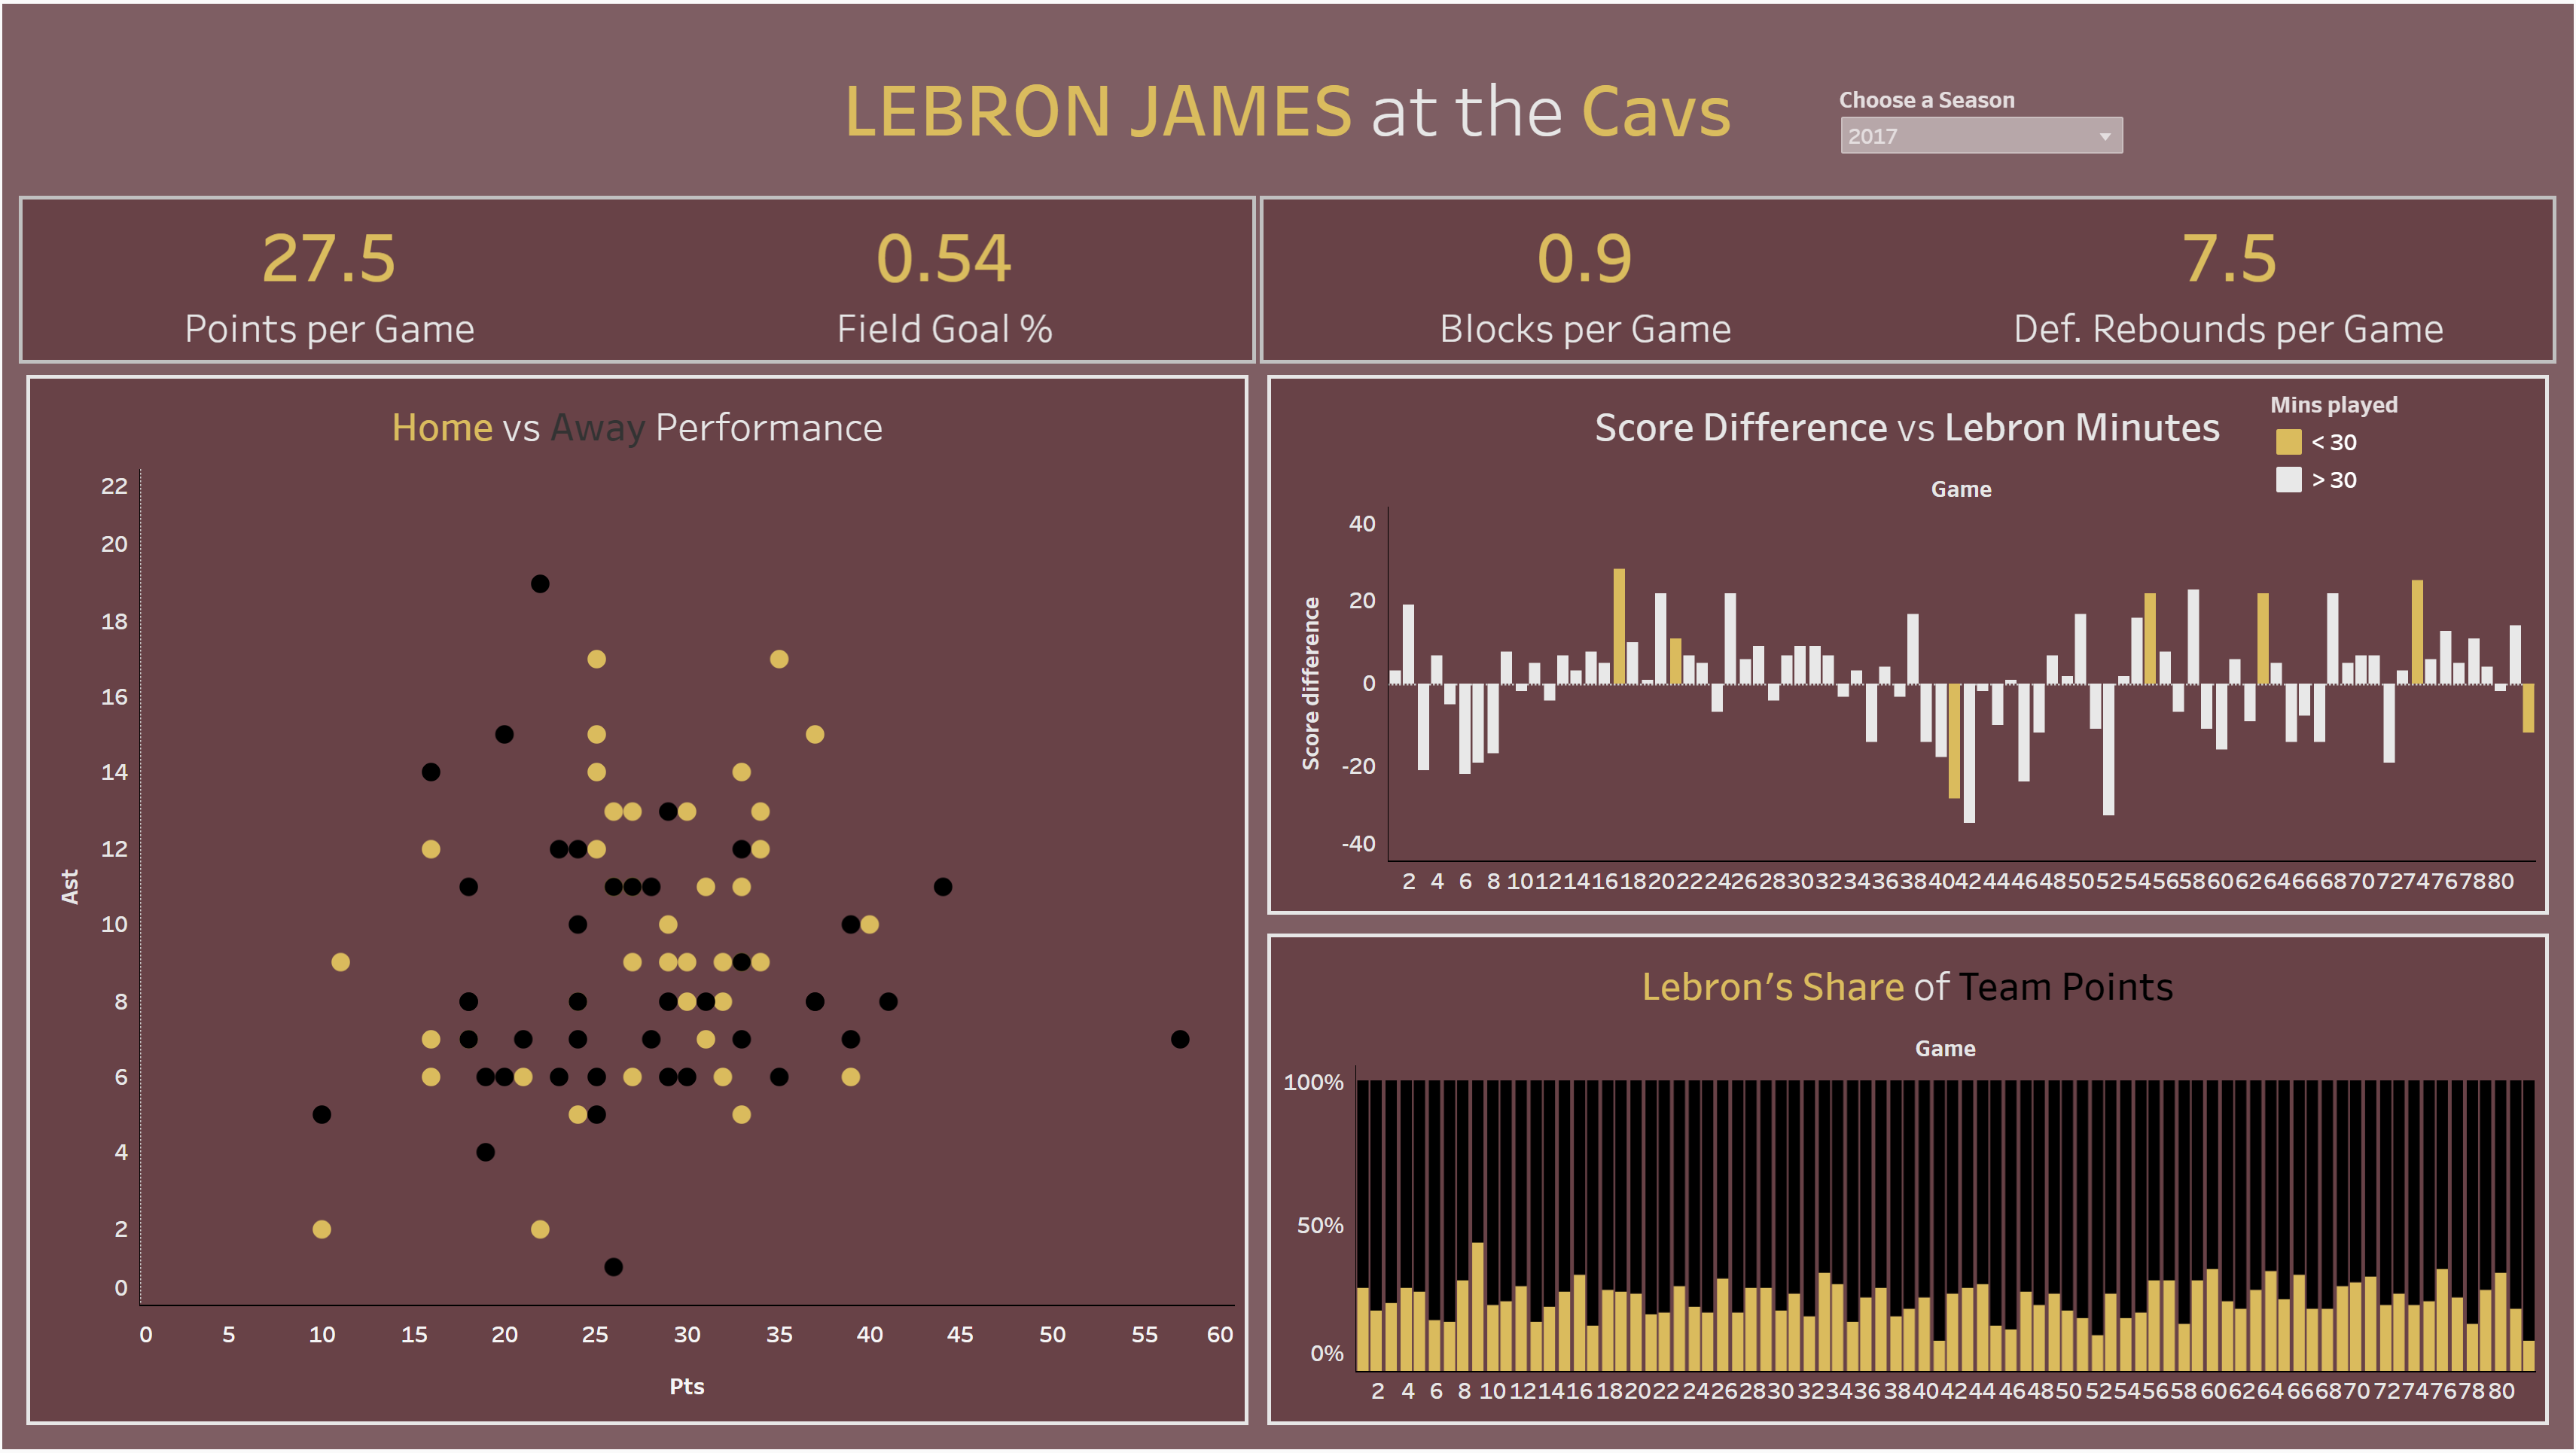
This was the dashboard I created:

I wanted to display some season average stats as KPIs along the top. The left chart is a game by game analysis of points vs assists, separated by Home and Away performance. I then wanted to look at how Lebron's minutes played affects the Cavs performance. As well as looking at Lebron's contribution to the Cavs points.
