


Today kicked off with downloading and unzipping several large datasets from the iMDB website containing information on every single title in their database. My main objective today was to plan everything out so that I had a solid structure to the day and wouldn't panic!

Starting with the data, ee had to use 7Zip to open the files and convert them into Tableau Prep friendly formats which was easy enough. Following this, I wanted to go through each dataset and note down its name, number of rows, and list of key fields/unique identifiers.
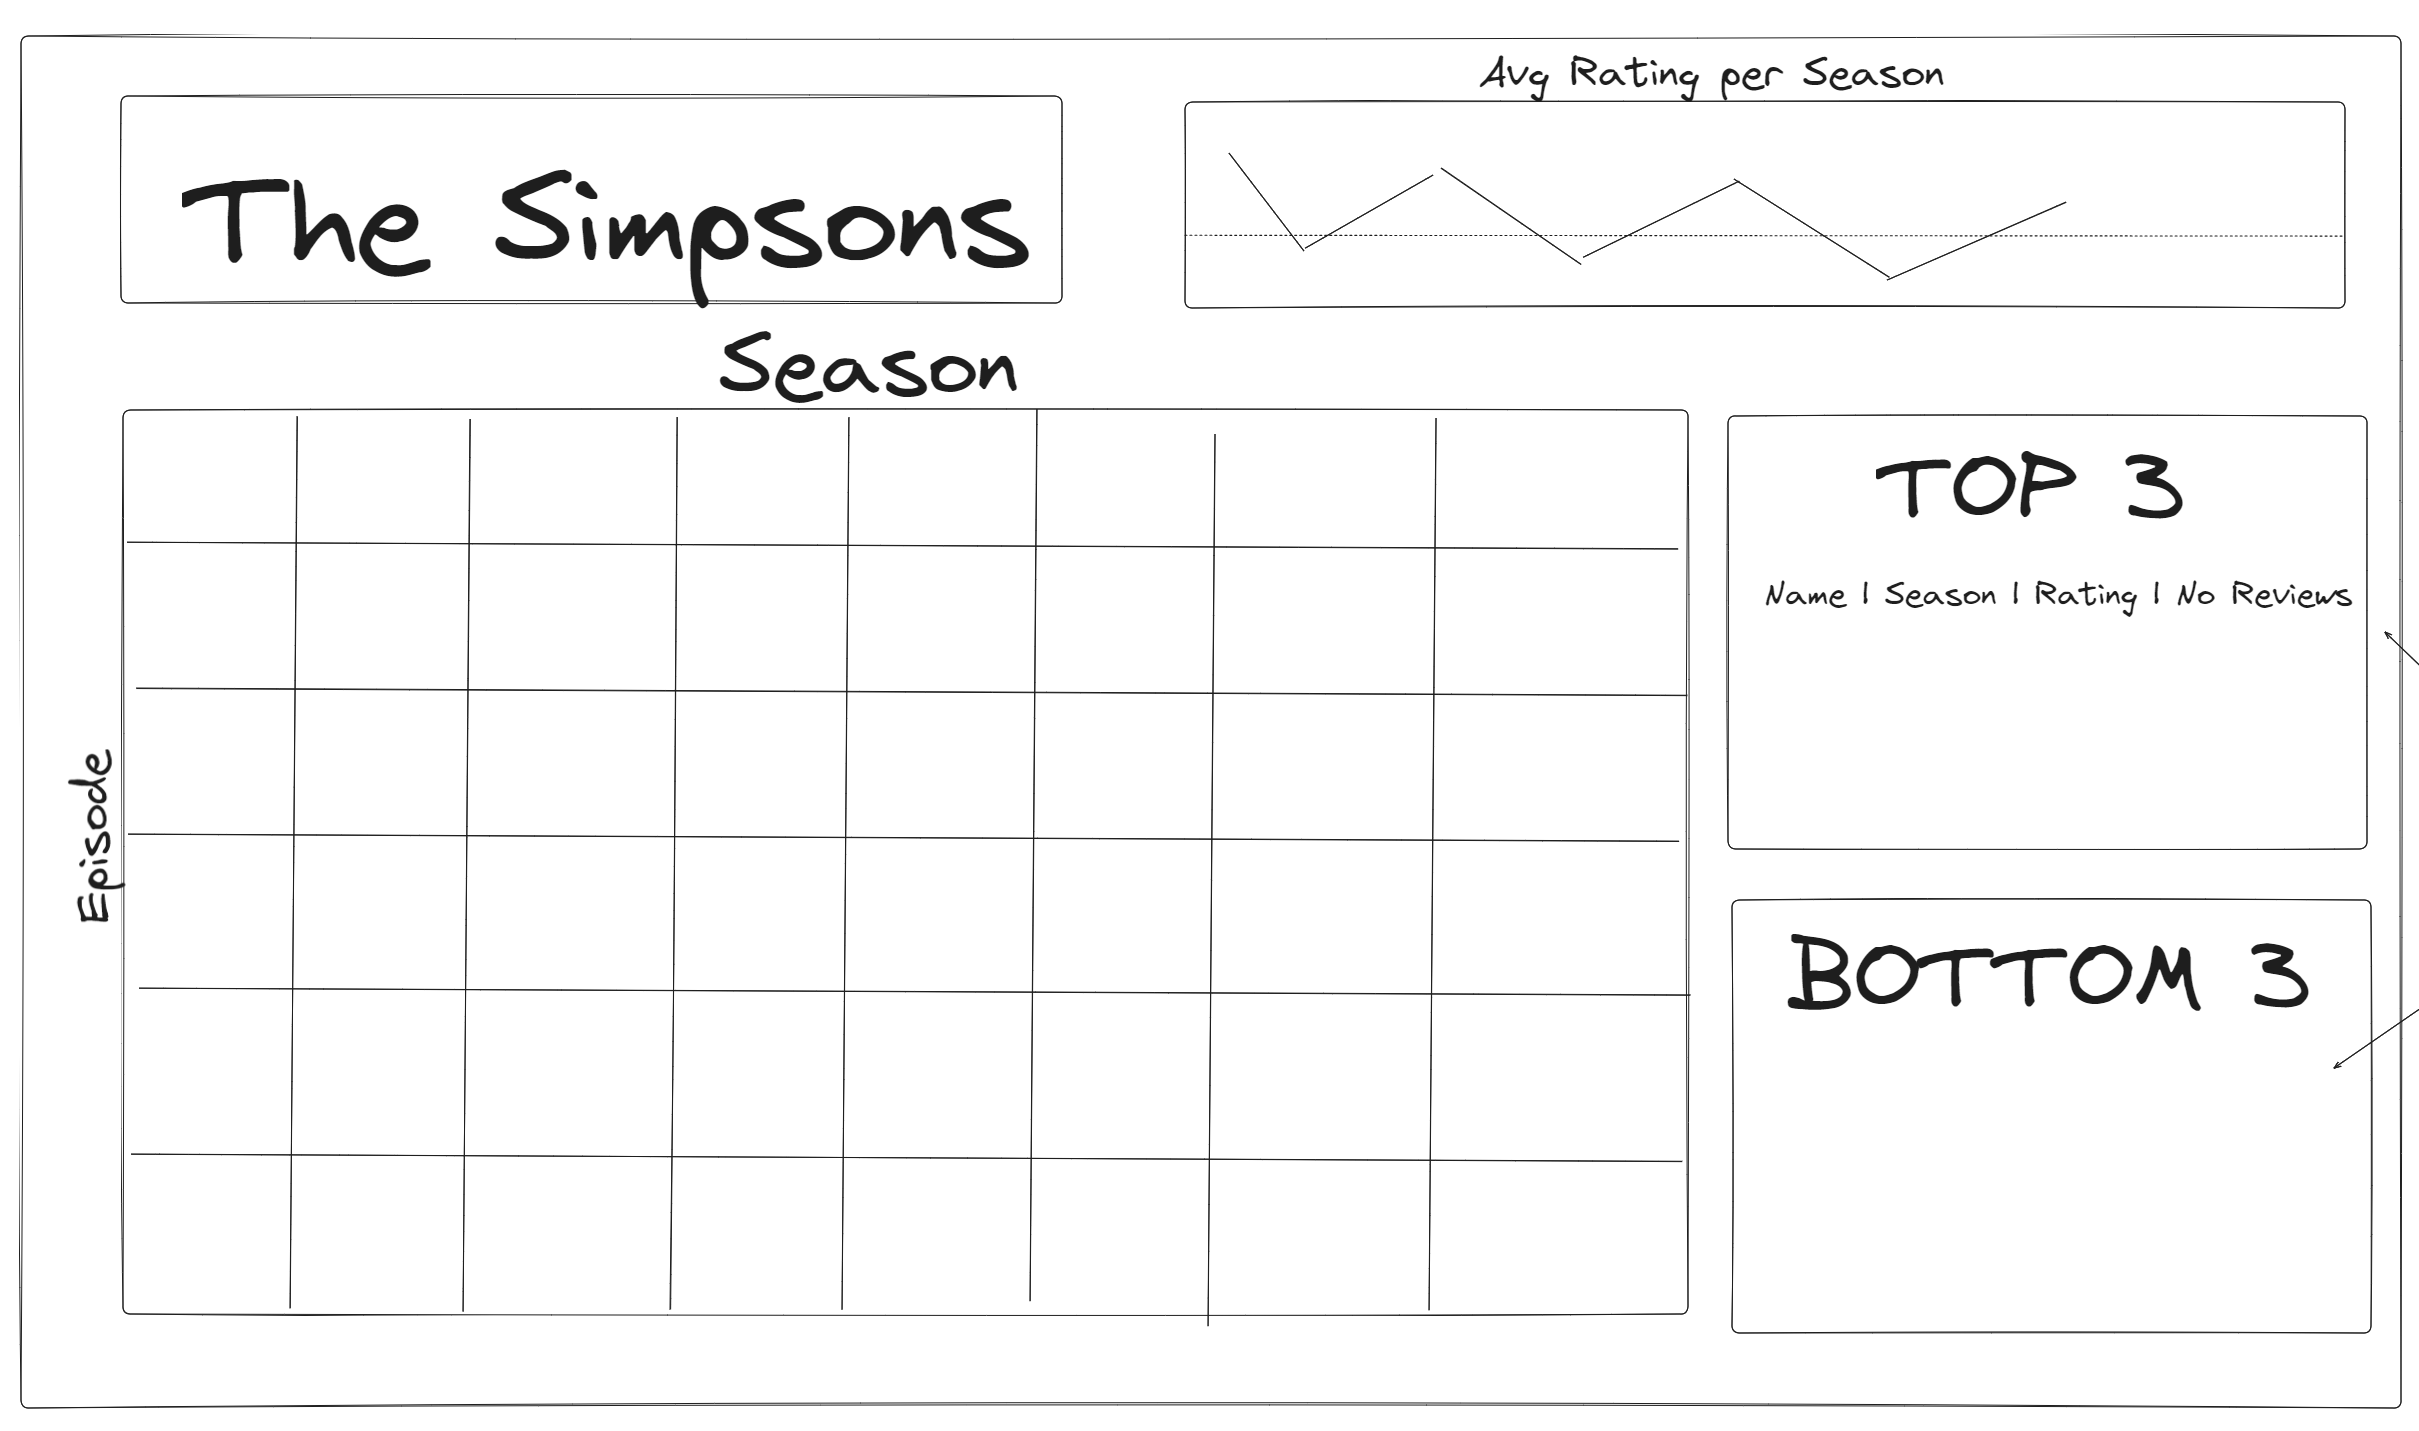
After this I wanted to figure out my desired data output, which would contain a row per episode with each field corresponding to characteristics about that episode (name, season number, episode number, episode rating). I decided to narrow down to one show, The Simpsons, to see if I could test the general consensus which is that the show drops in quality as the season go on.
This is my sketch:
This is what I came up with!
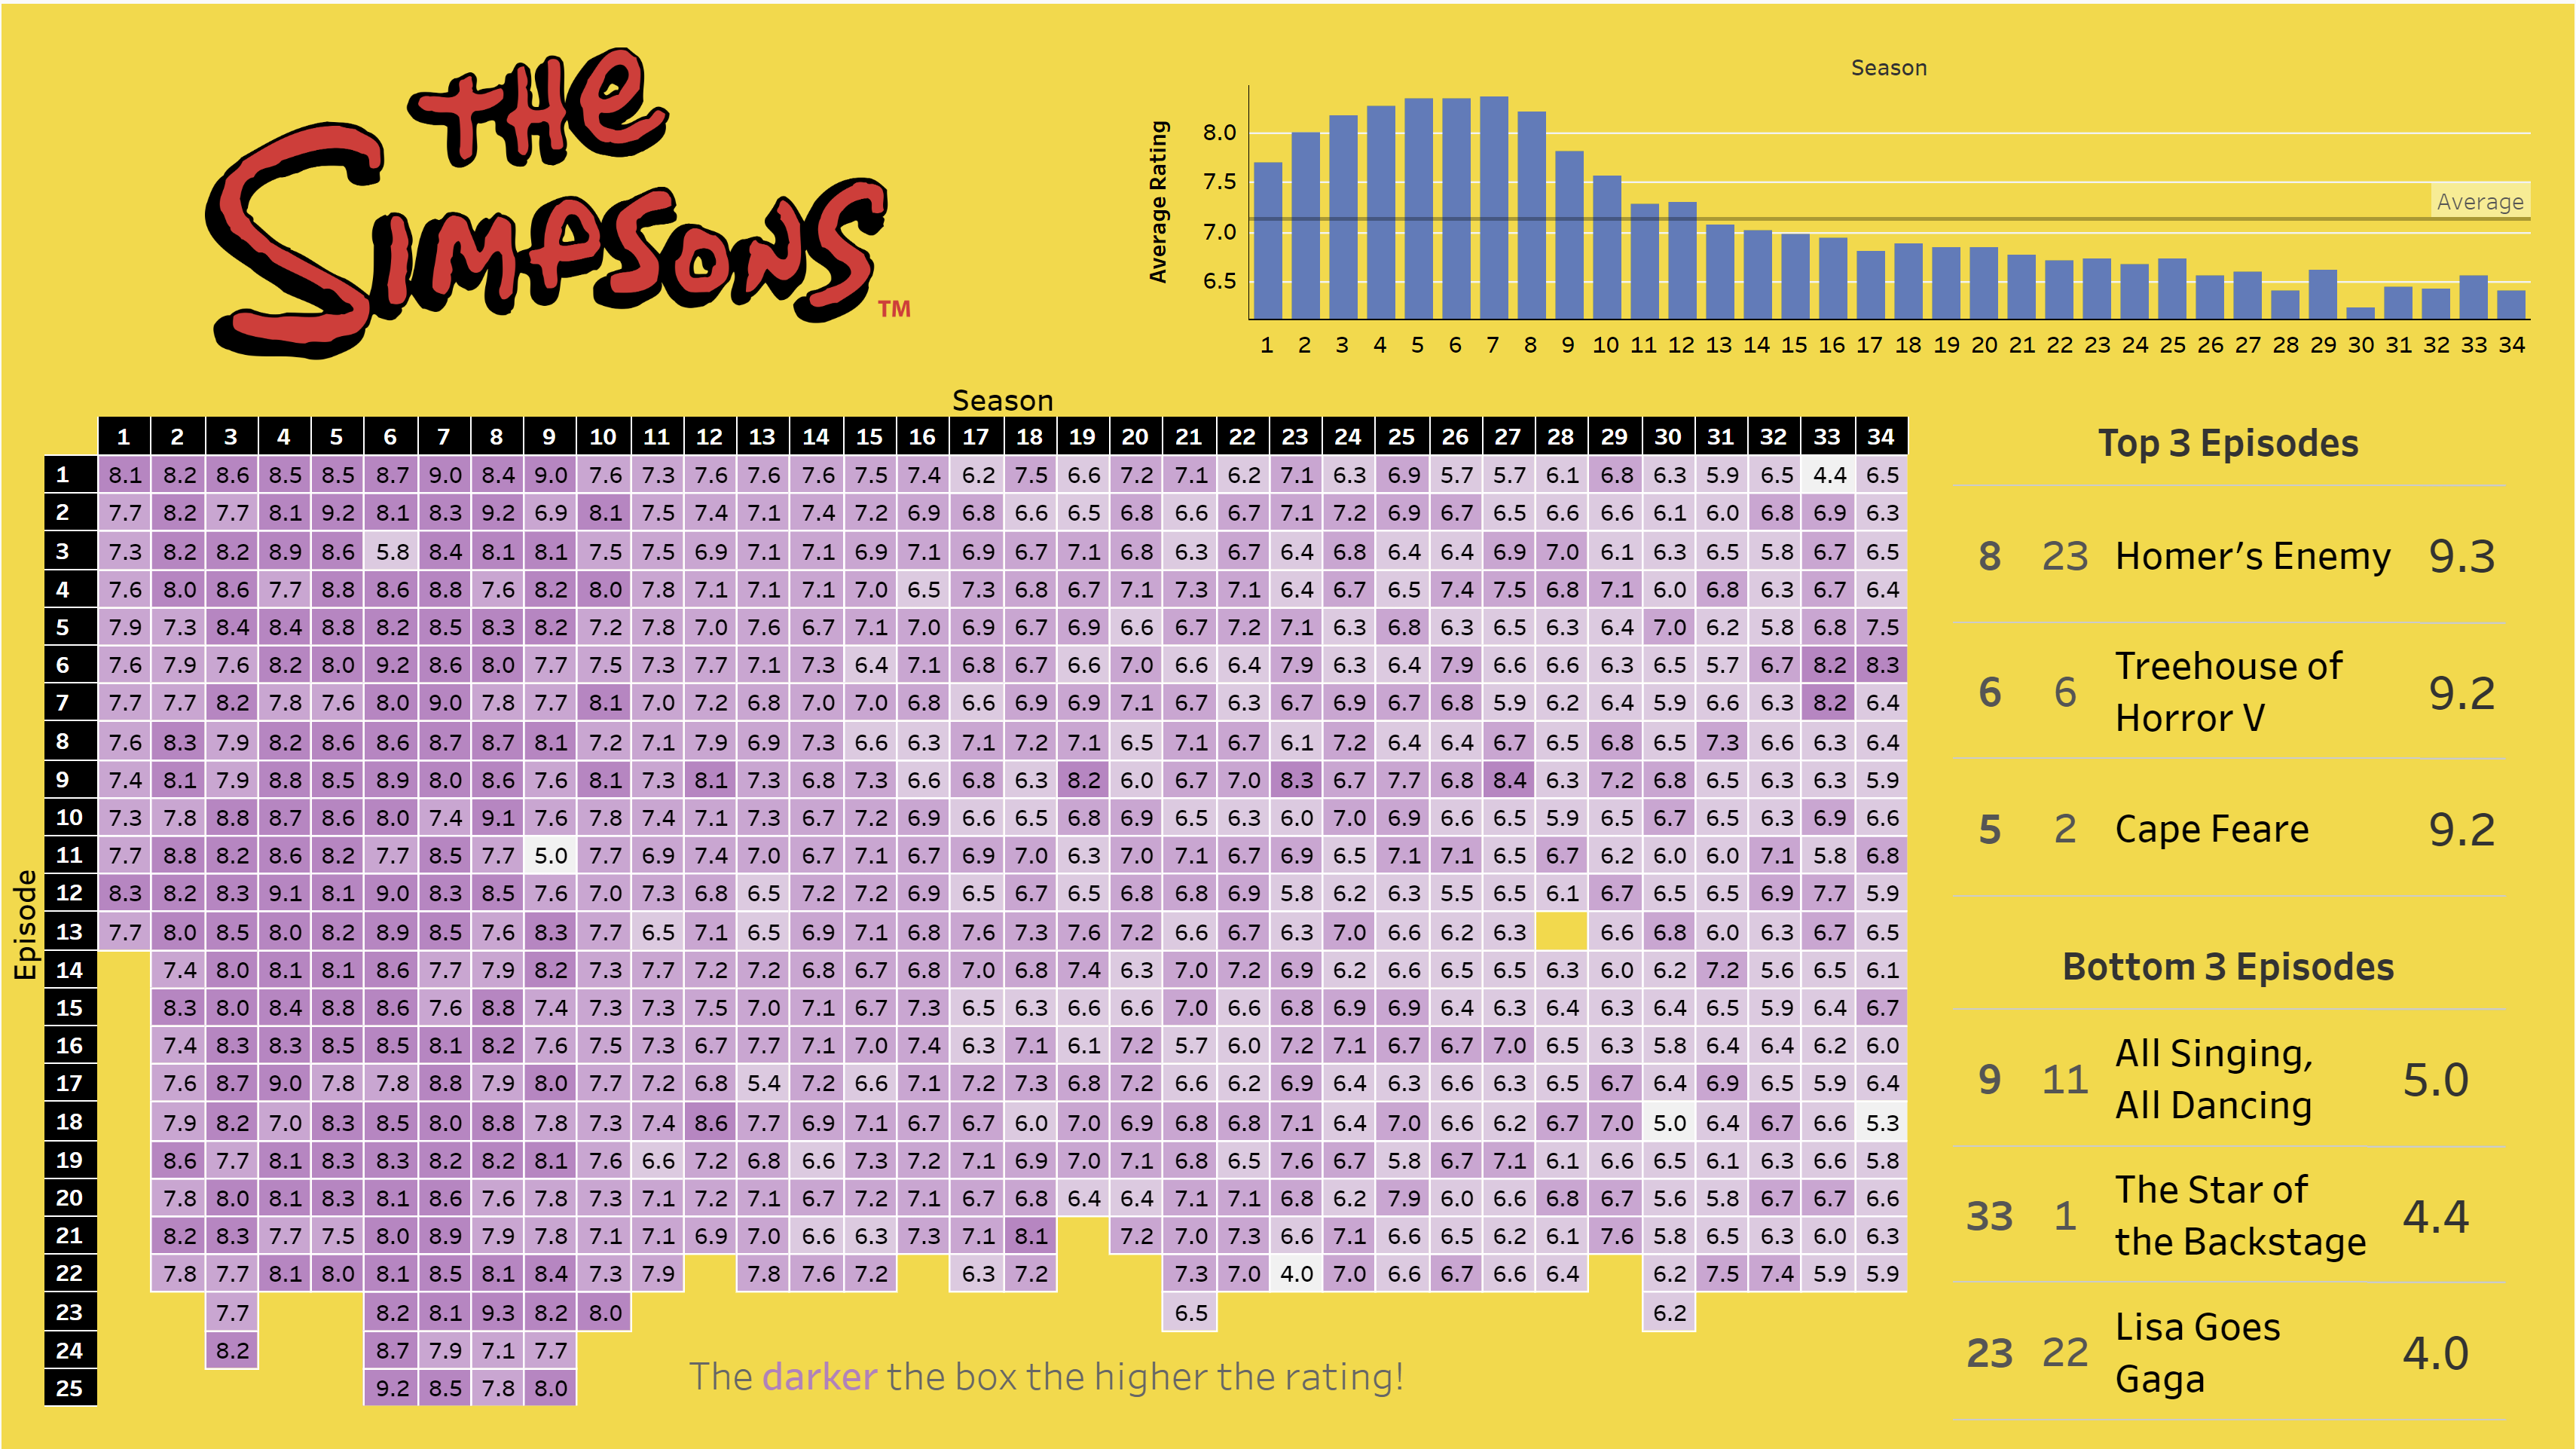
I wanted to add the episode synopsis to the tooltip of the heatmap, but this wasn't in the provided data but is something I'll look to include in the future!