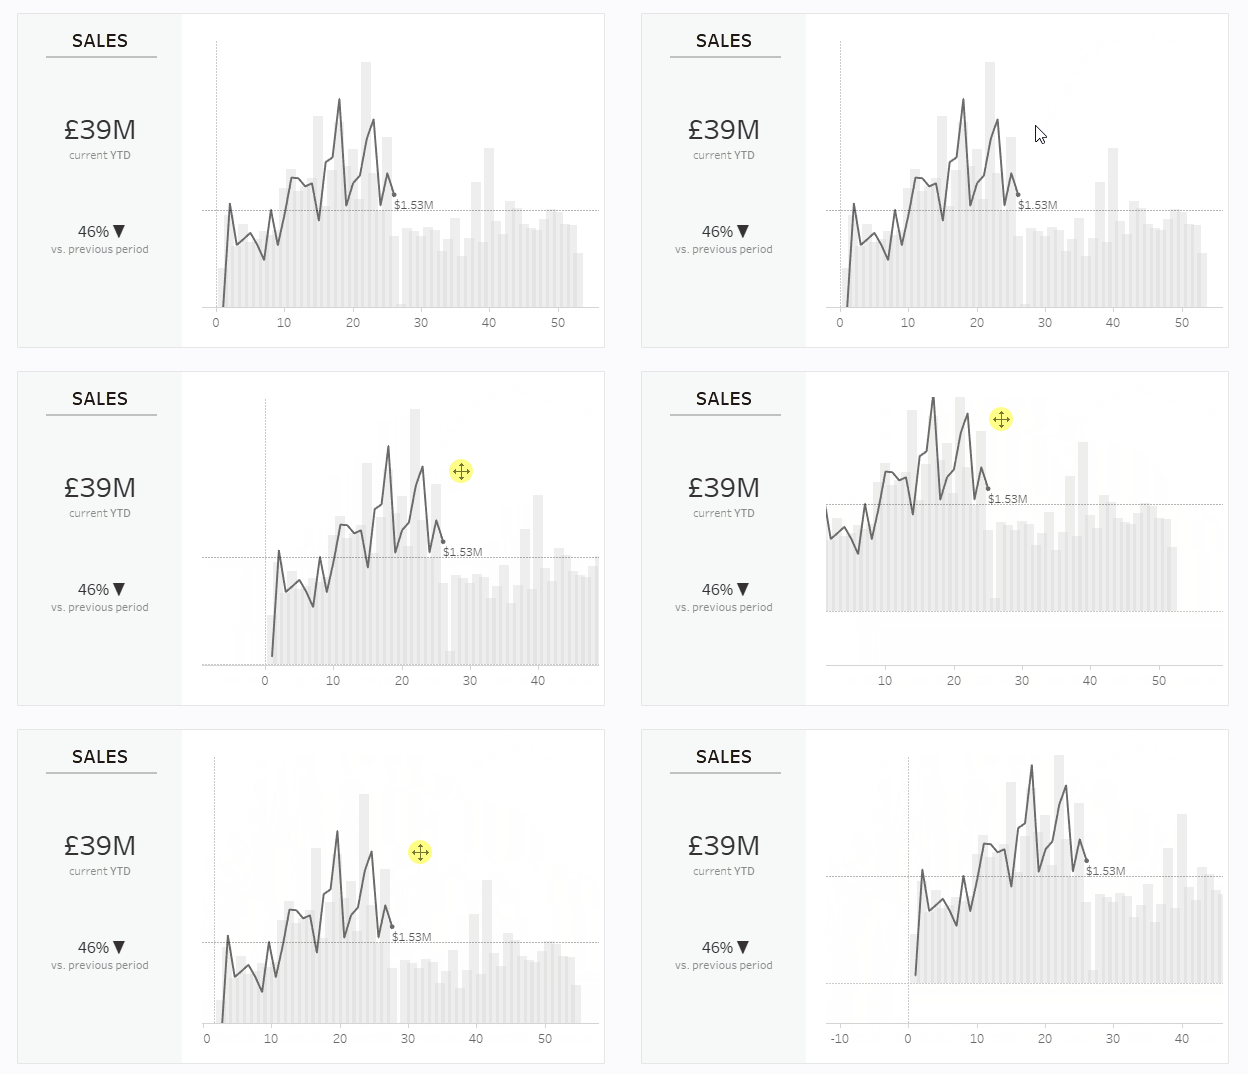
Today was our final day of dashboard week and also of DS31's training. I was therefore surprised to discover a feature in Tableau completely by accident. This is the ability to pan a chart. This is enabled by holding SHIFT and dragging the chart with your mouse. This has the effect of fixing the chart axis to the visible ranges after panning. Here's an example using one of the charts I produced today.

