Over the past week I have produced 3 Workout Wednesdays.
WOW 2024 Week 32
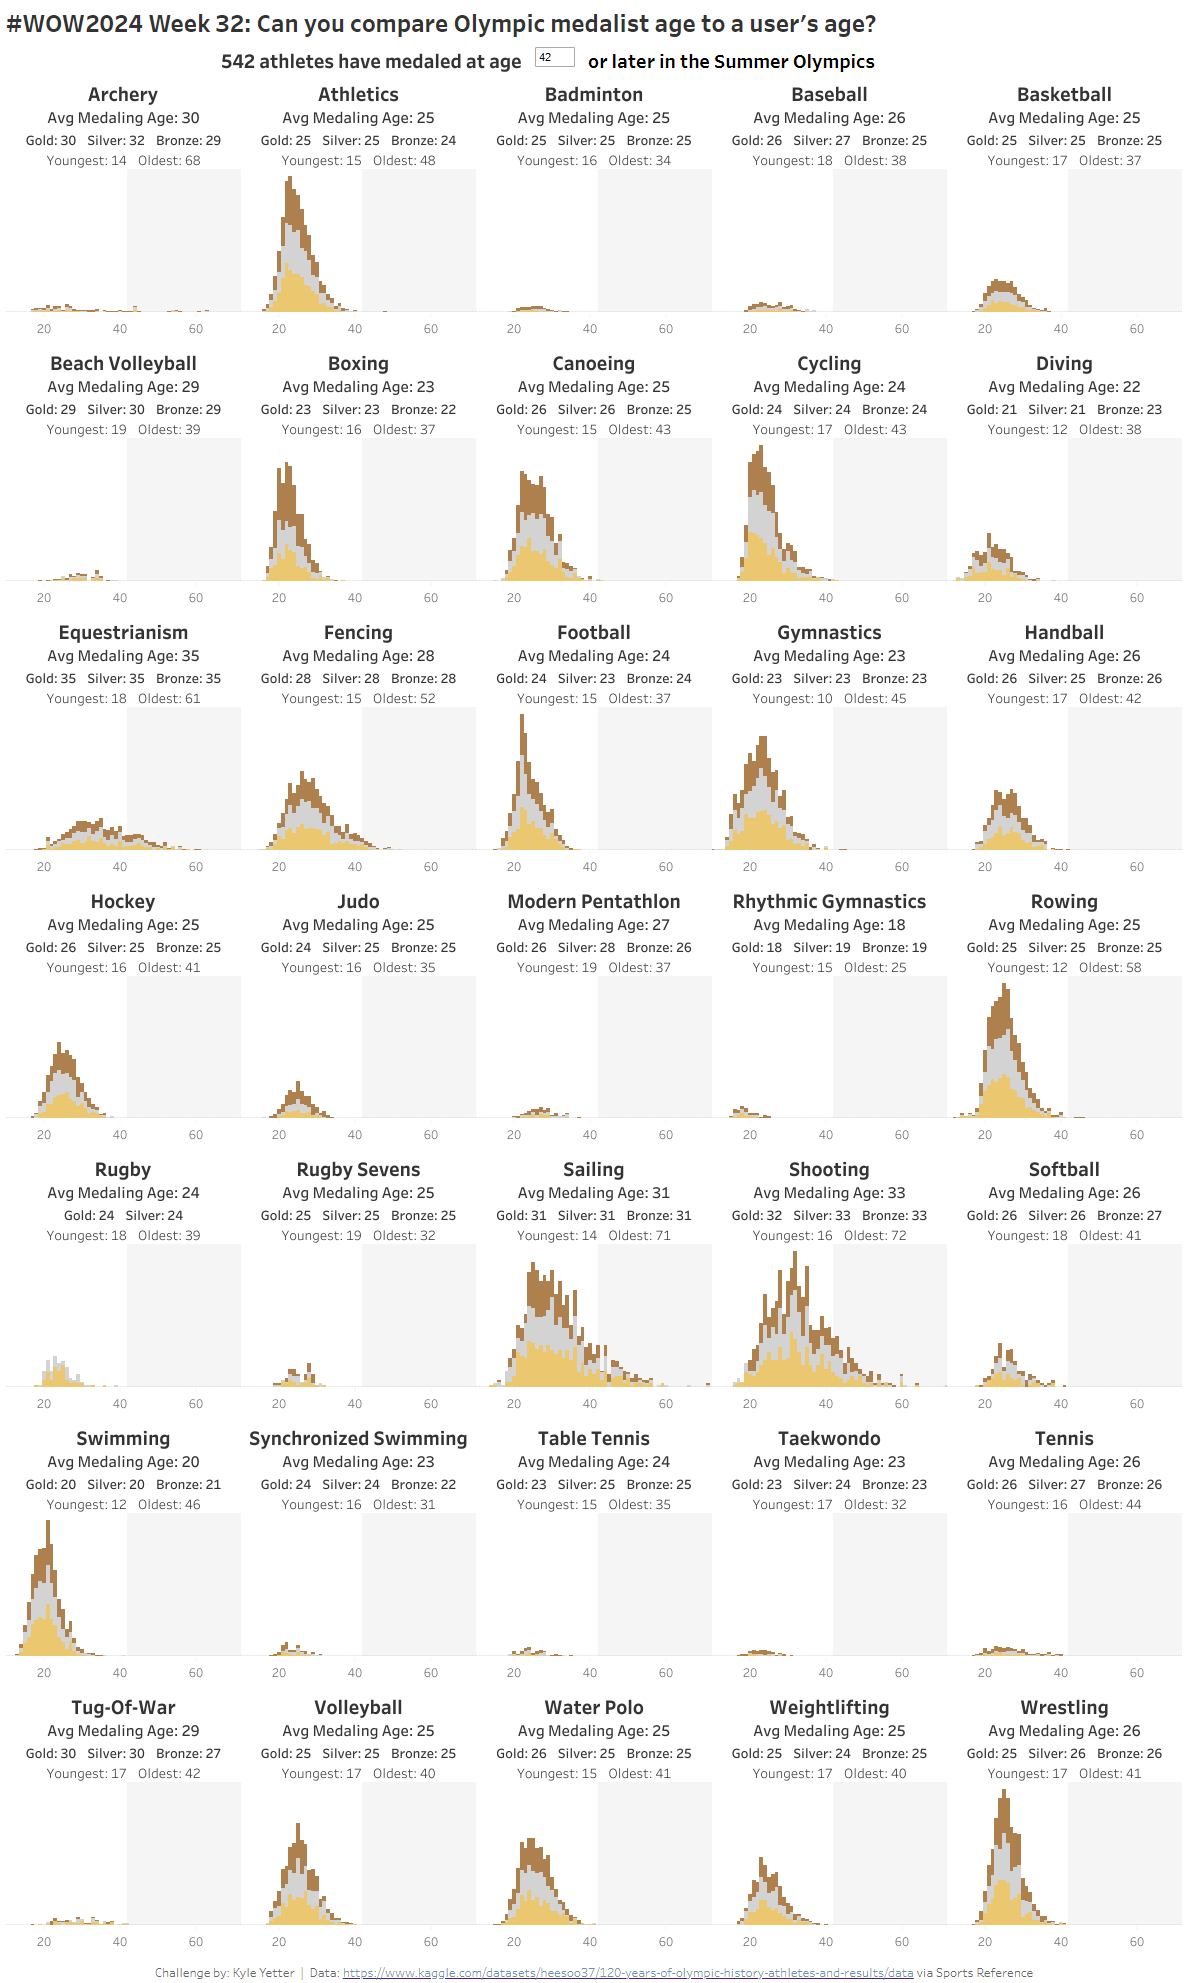
The first of which asked me to create a dashboard looking at how old medalists in each sport have been, with the ability to highlight a certain age or older. Here was my version:

Lessons Learned:
- This WOW was one of my first entries into the world of LODs as they were used to isolate the average medaling for EACH sport.
- I learnt how to effectively make dynamic headers within my charts, a skill im sure I'll end up using frequently.
- Within this was how to use the STR function to not just have one value or string within a header.
WOW 2022 Week 22
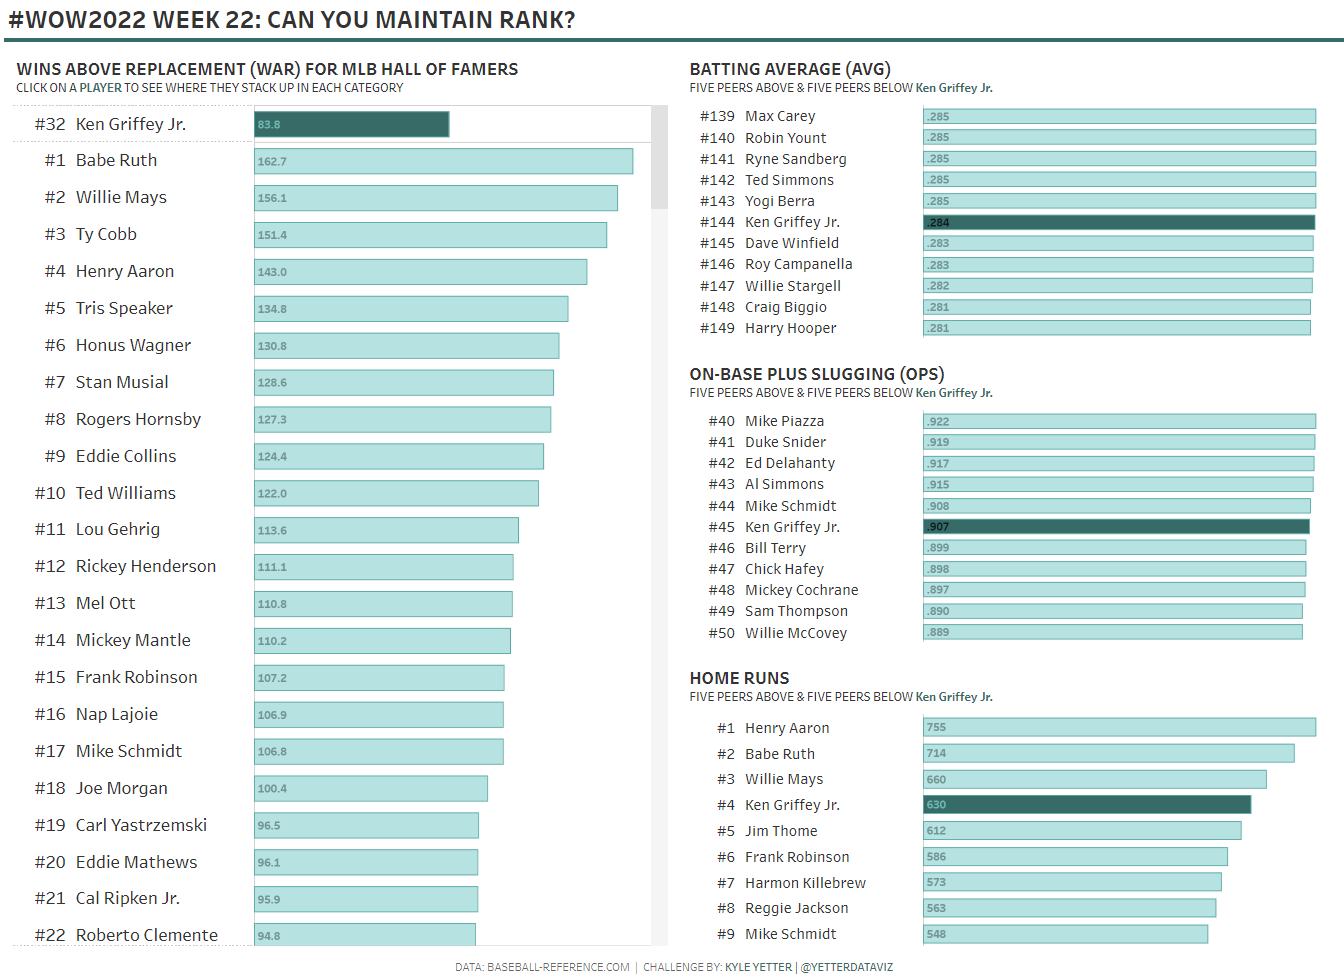
This WOW challenge involved creating comparison charts that maintain rank even when bringing a selected member to the top. A great way of potentially comparing, in future, how different products or departments stack up against each other in multiple metrics.
Here was my version:

Lessons Learned:
- This challenge involved using Window calcs, a group of functions new to me. Thankfully this challenge was an interesting one so was a nice introduction into their use cases.
WOW 2024 Week 49
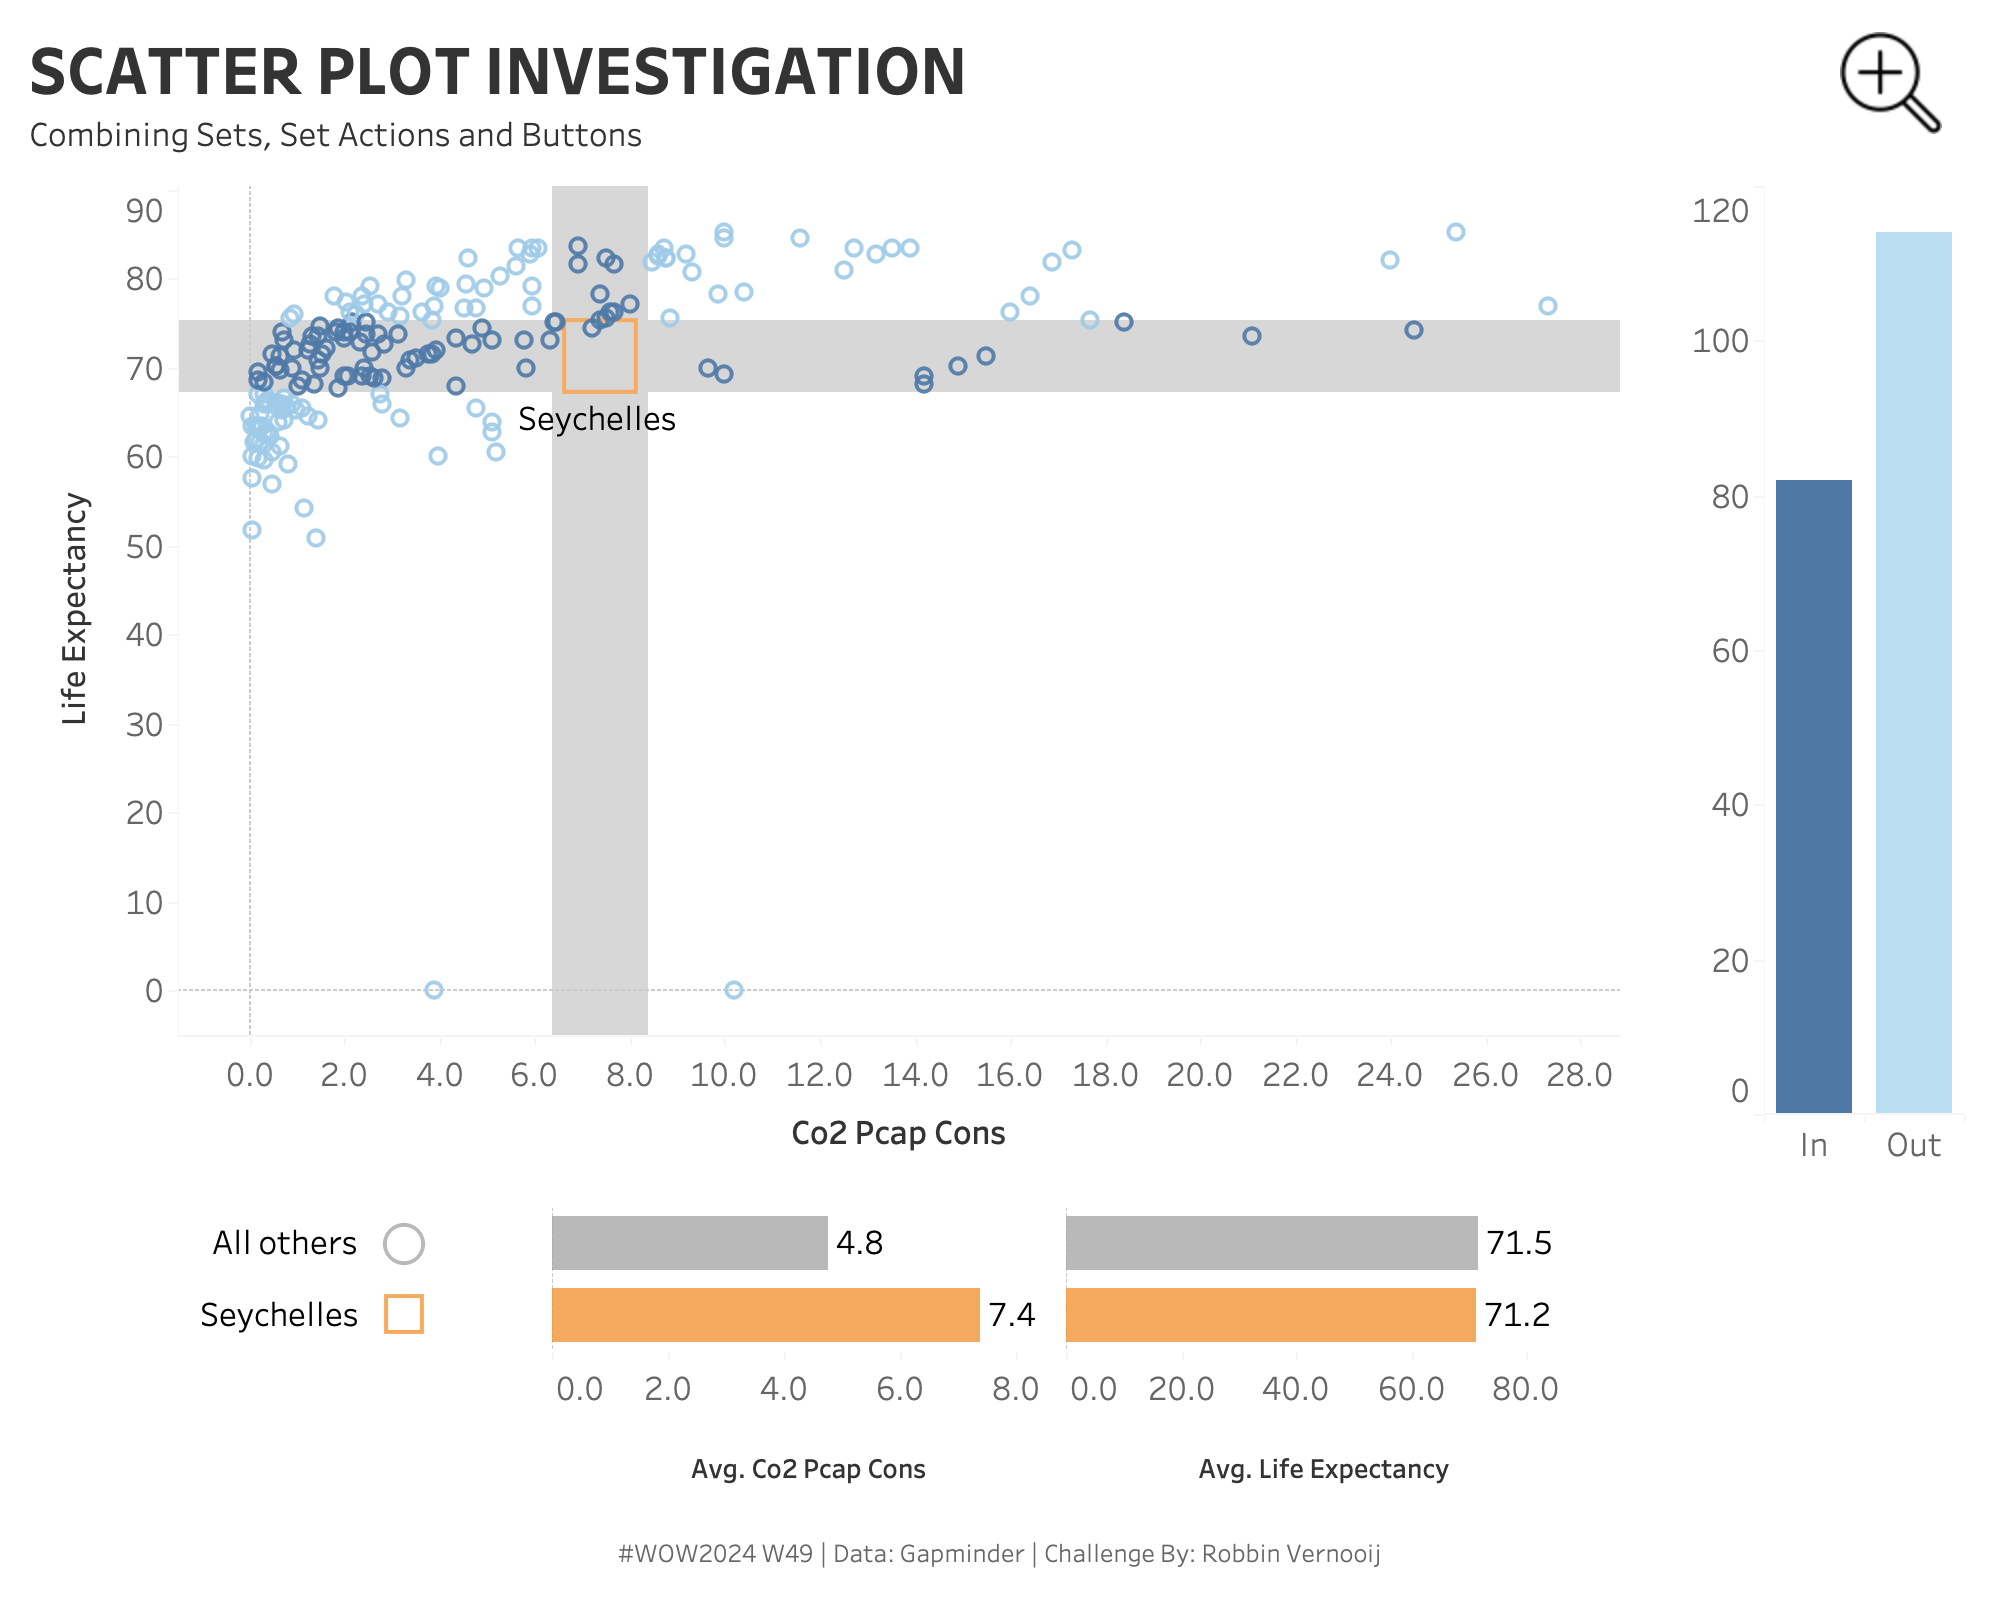
This might be my favourite challenge from this week as it created a fun interactive dashboard while combining lots of the skills we learnt throughout the week. Such as sets, parameters, Window calcs and actions. The dashboard aimed to allow you to see the average life expectancy, air quality and count of countries that fell within a small range of our selected nation. Colouring our country dots depending on their status.
Here is my version:

Lessons learned:
- This challenge involved a few cool, but less intuitive, features that I found interesting.
- Using the marks card to make one field different sizes, shapes and colours.
- This allowed me to have two colour fields in my marks card, to create the colour grouping and the colour of my selected country 'square'.
- I was also able to create the large square by having a size field which made my selected country a lot bigger than the other countries.
- Within my bottom bar charts the 'row headers' are actually just a created AVG(1) field with my Boolean country set as a shape chart type. Allowing you to get this nicer looking header which includes the label and shape type.
Here are links to the original challenge postings :