You may have noticed in Tableau that some fields are BLUE and some are GREEN. But have you ever wondered why they are different colours?

In Tableau these colours represent which fields are discrete and which are continuous.
Blue fields are discrete, meaning they contain a finite number of values (e.g., hair colour).
Green fields are continuous, meaning they contain a (theoretically) infinite number of values (e.g., salary could be ANY amount of money along a number line).
Using Blue/Green fields on filters
One of the many ways that these field types differ within Tableau is the way by which they can be filtered.
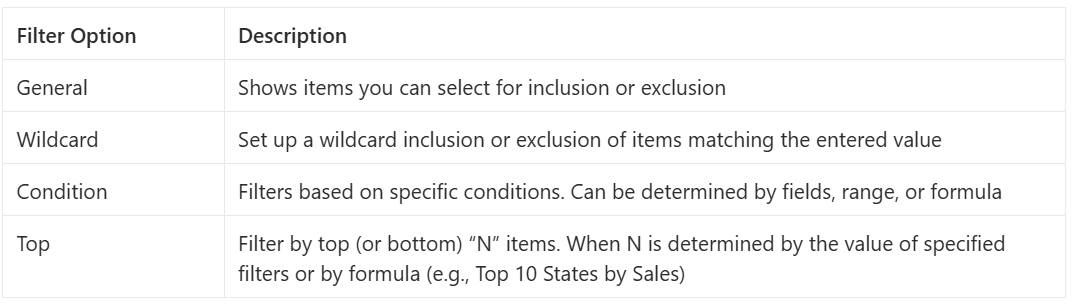
Blue (Discrete)
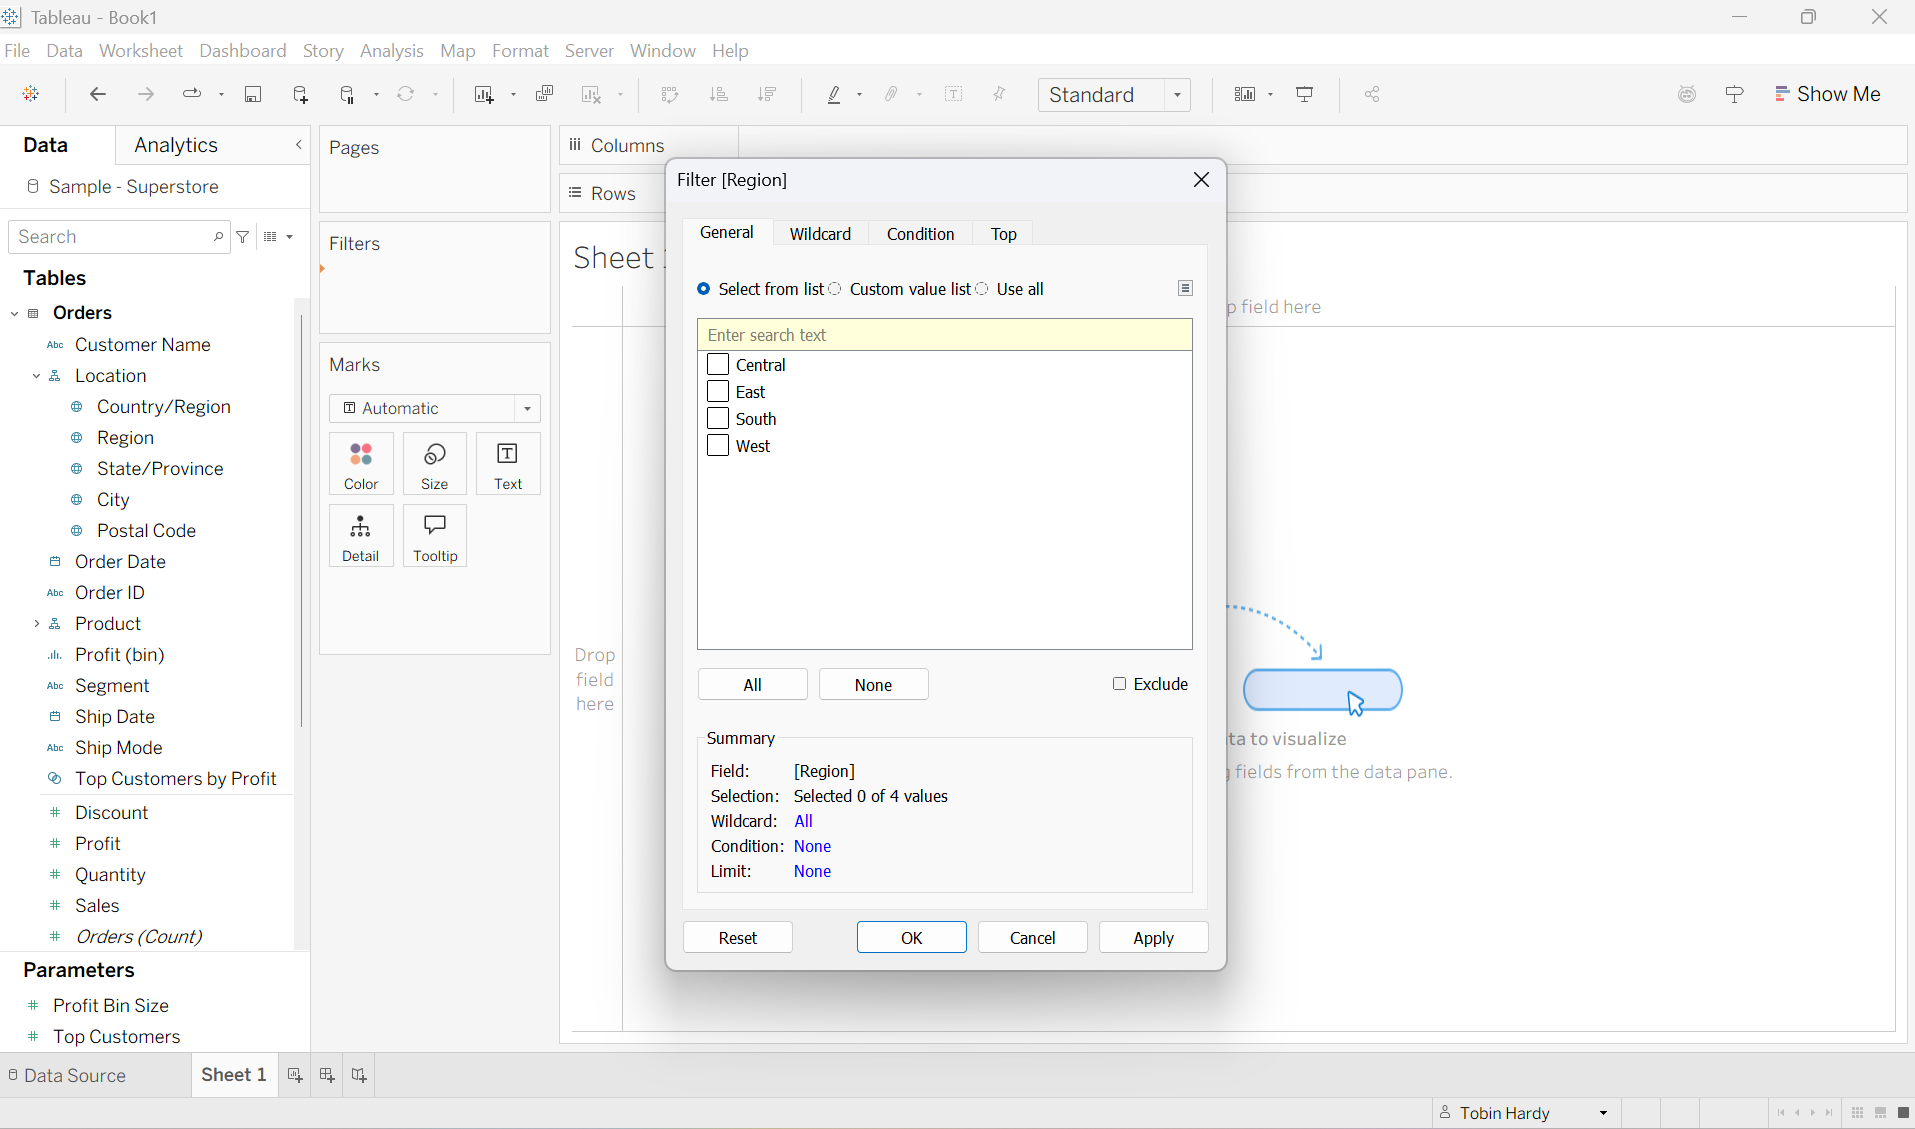
Placing a blue field on the filter shelf causes Tableau to display a text page asking which ‘items’ should be included in your sheet.
General
Allows you to either include or exclude items through individual selection. For example, if I wanted to look only at the ‘East’ region then I would just ‘select’ the East box.
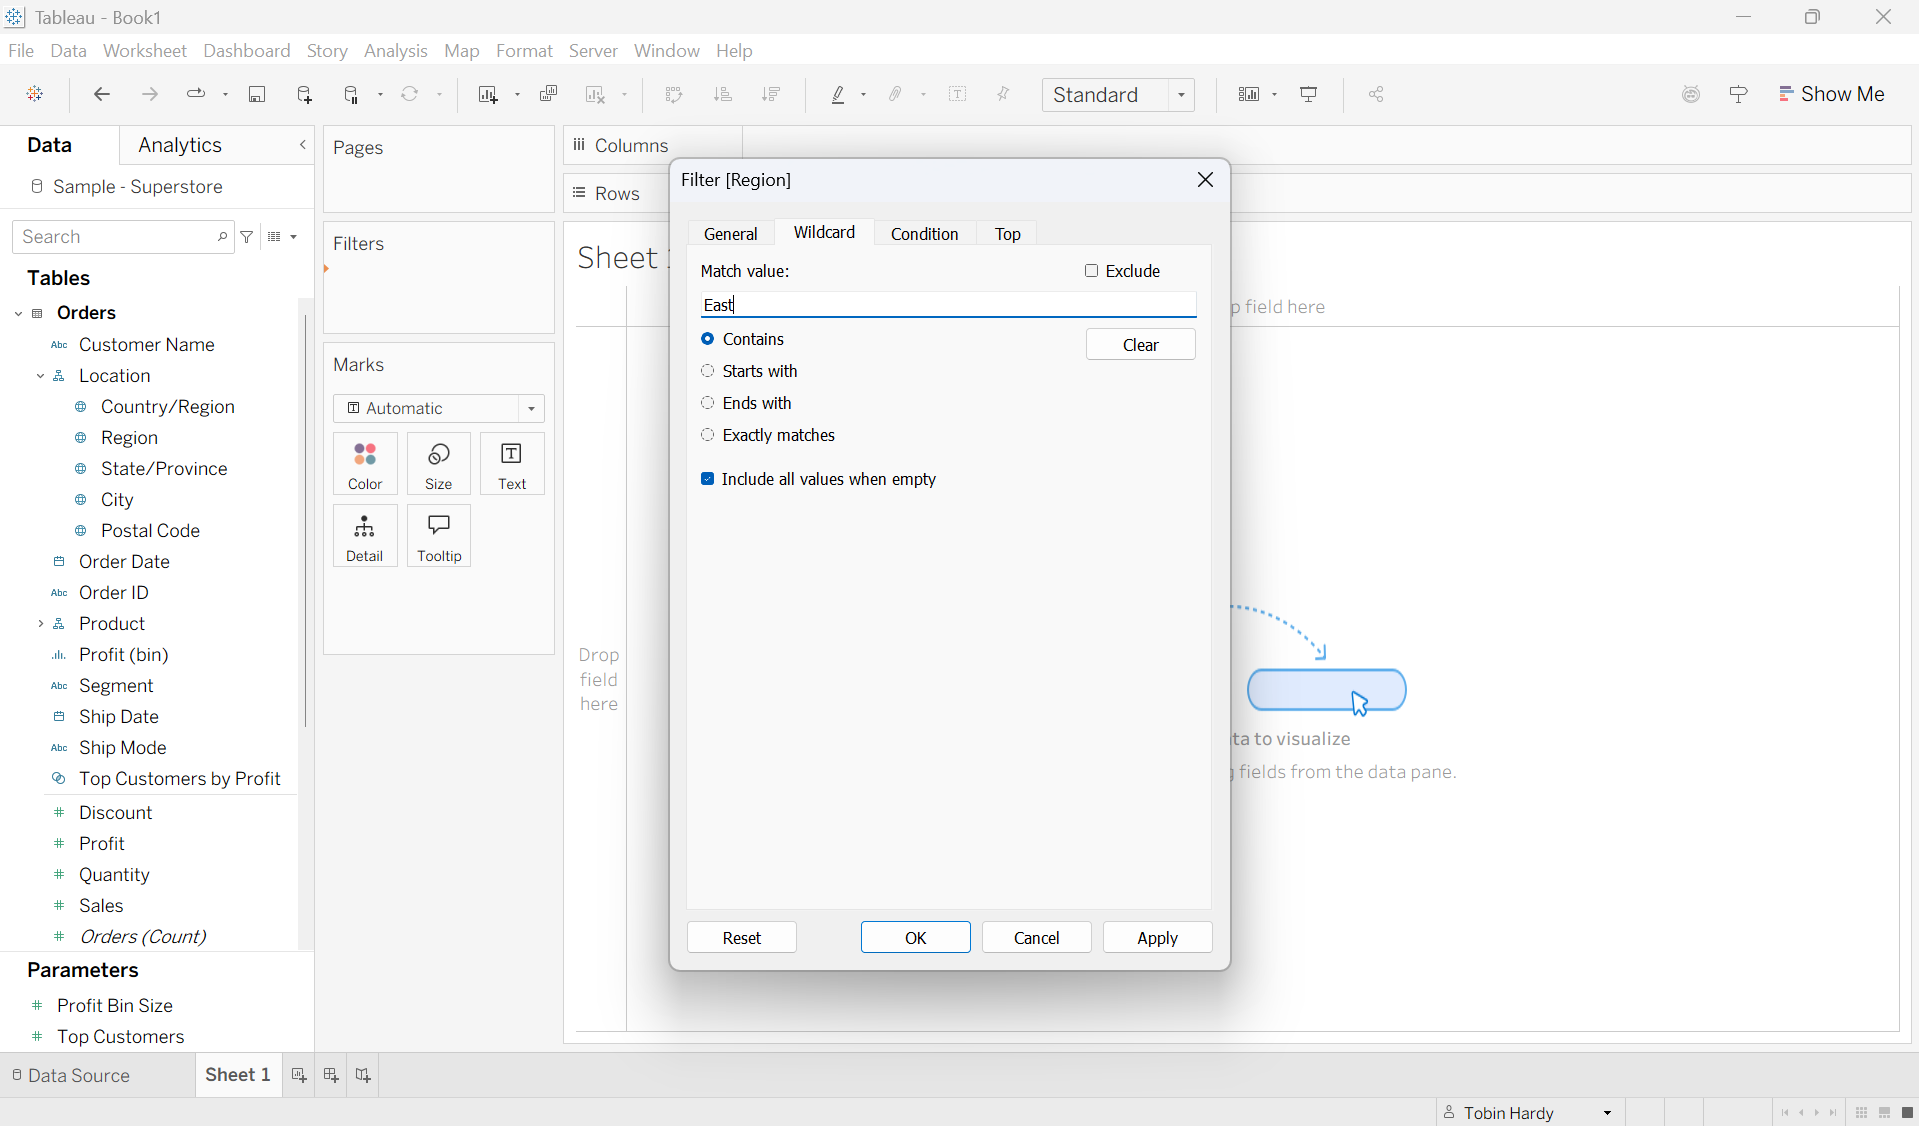
Wildcard
Here I can choose to either ‘include’ or ‘exclude’ items through a sort of “search bar.” For example, I could include only East by typing ‘East’ into the bar. You can also choose to filter by the starting or ending values of items.
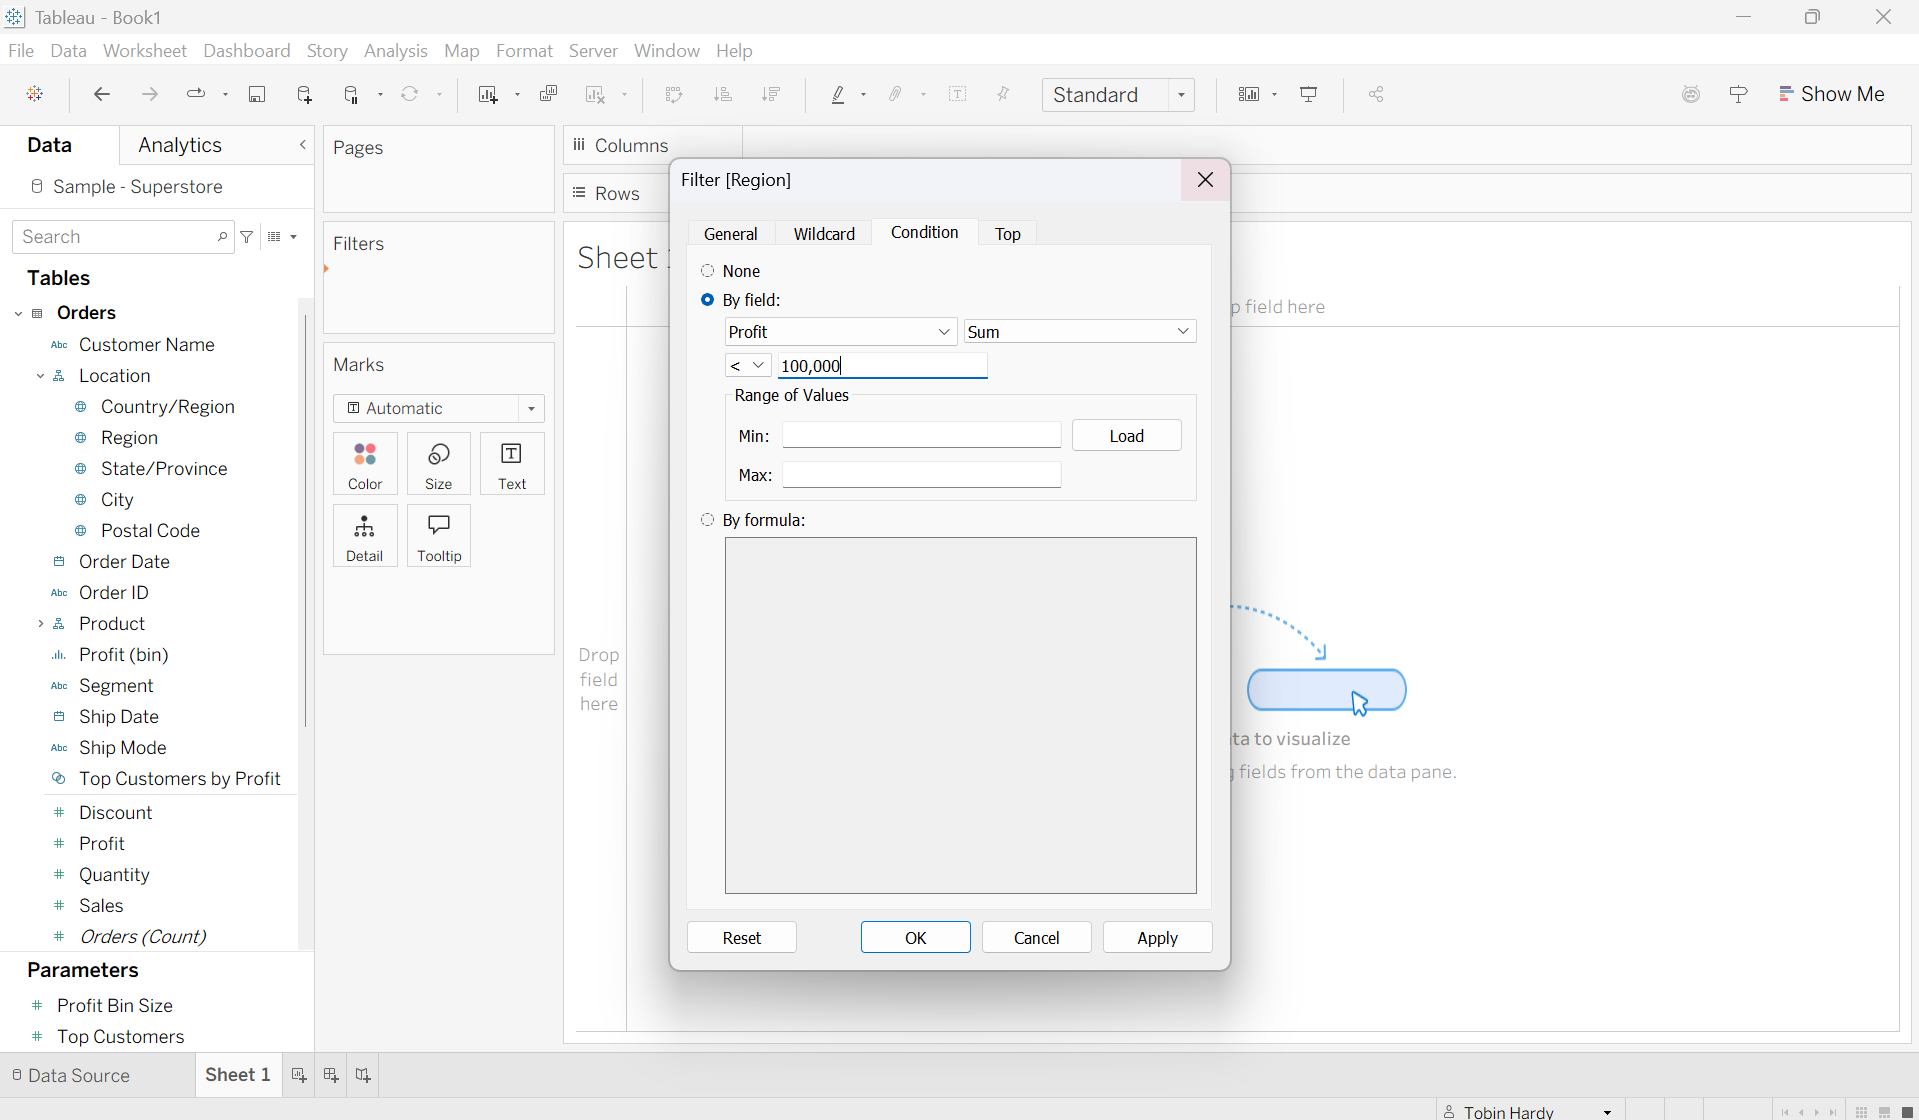
Condition
Within condition, you can filter by fields, range or formulas. In this example, I wish to look at only the regions with less than a total profit of $100,000. However, I could easily change the way it is filtered by clicking the box containing ‘<’. The field and aggregation it is filtered on can also be adjusted.
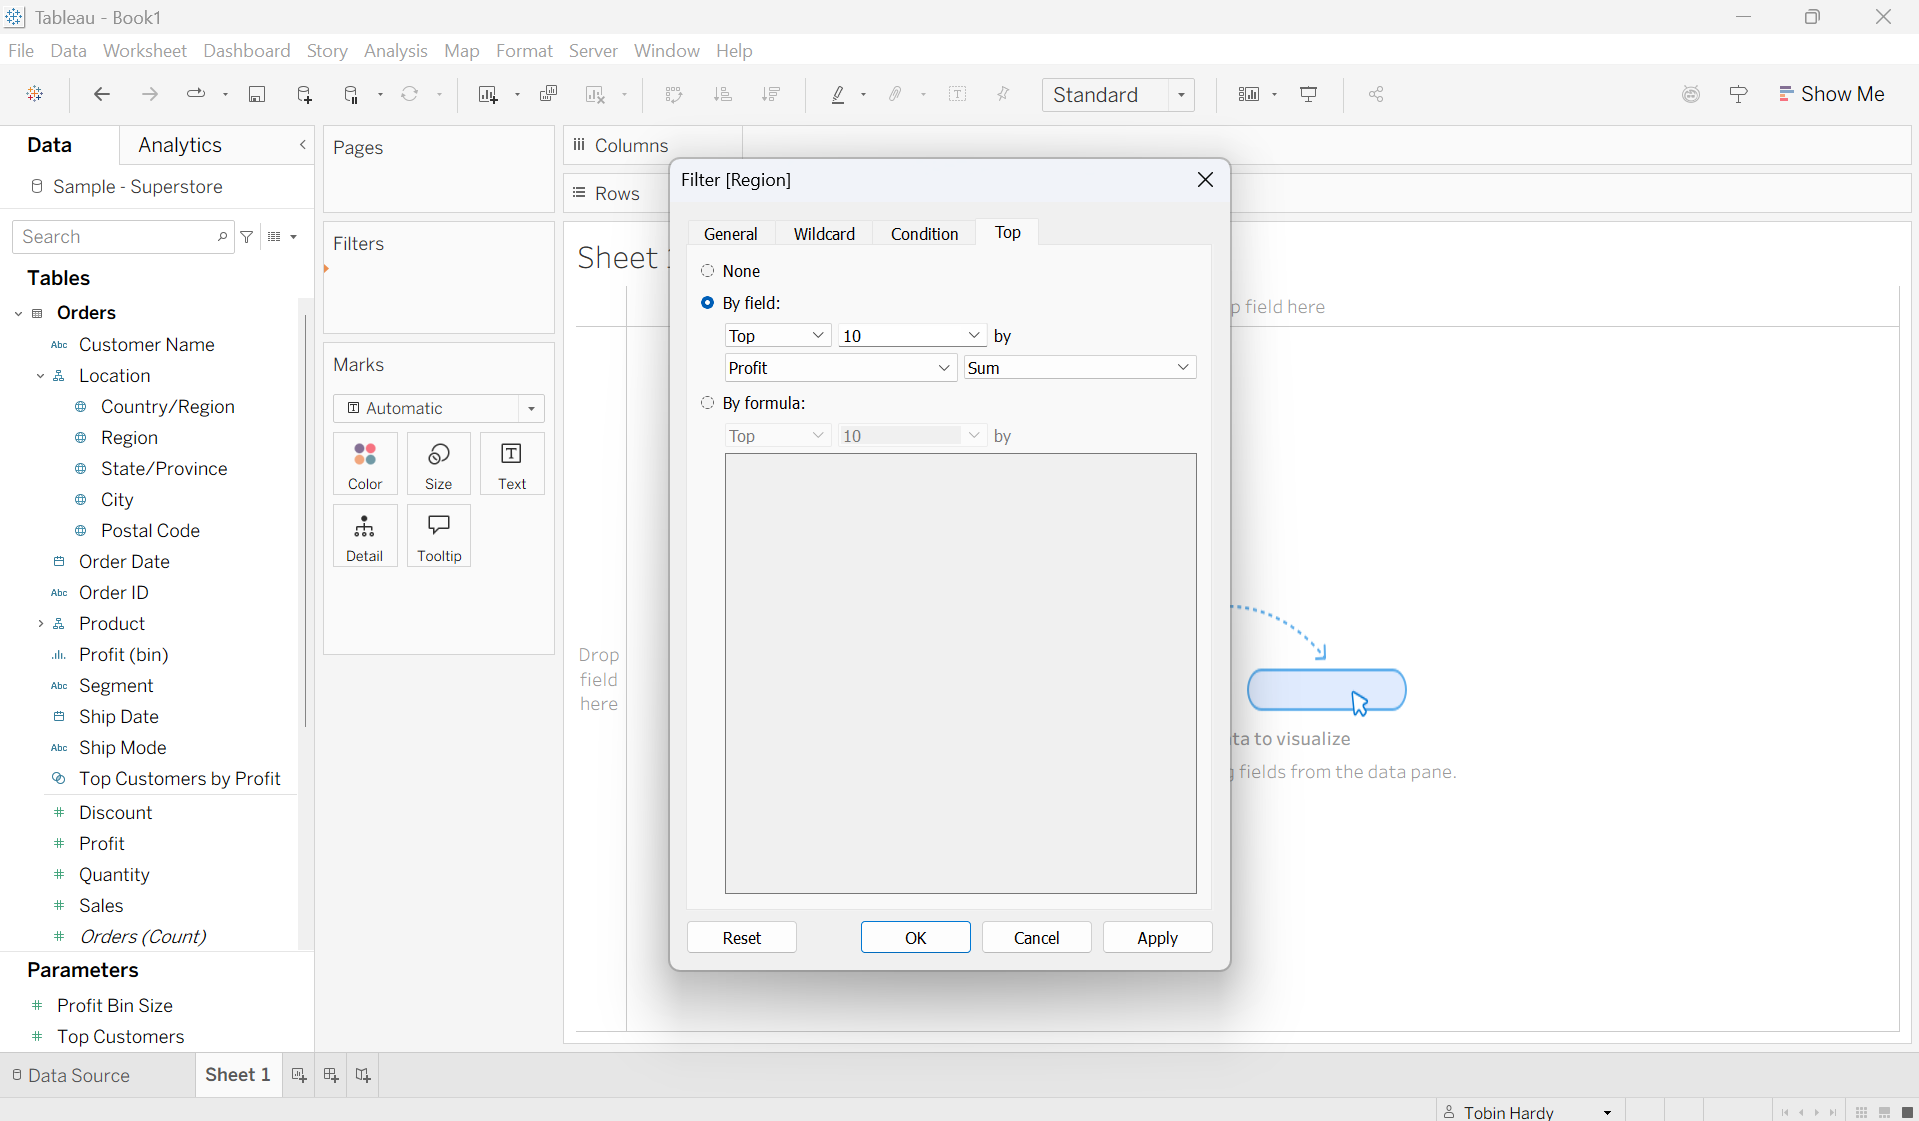
Top
Here you can filter by the top (or bottom) number of “N” values. Where N is determined by the value of specified filters, or by a formula. For example, here I am looking to filter by only the Top 10 regions by total profit. Again, this filter can be adjusted to whatever field and aggregation you desire.
Blue (discrete) filter overview
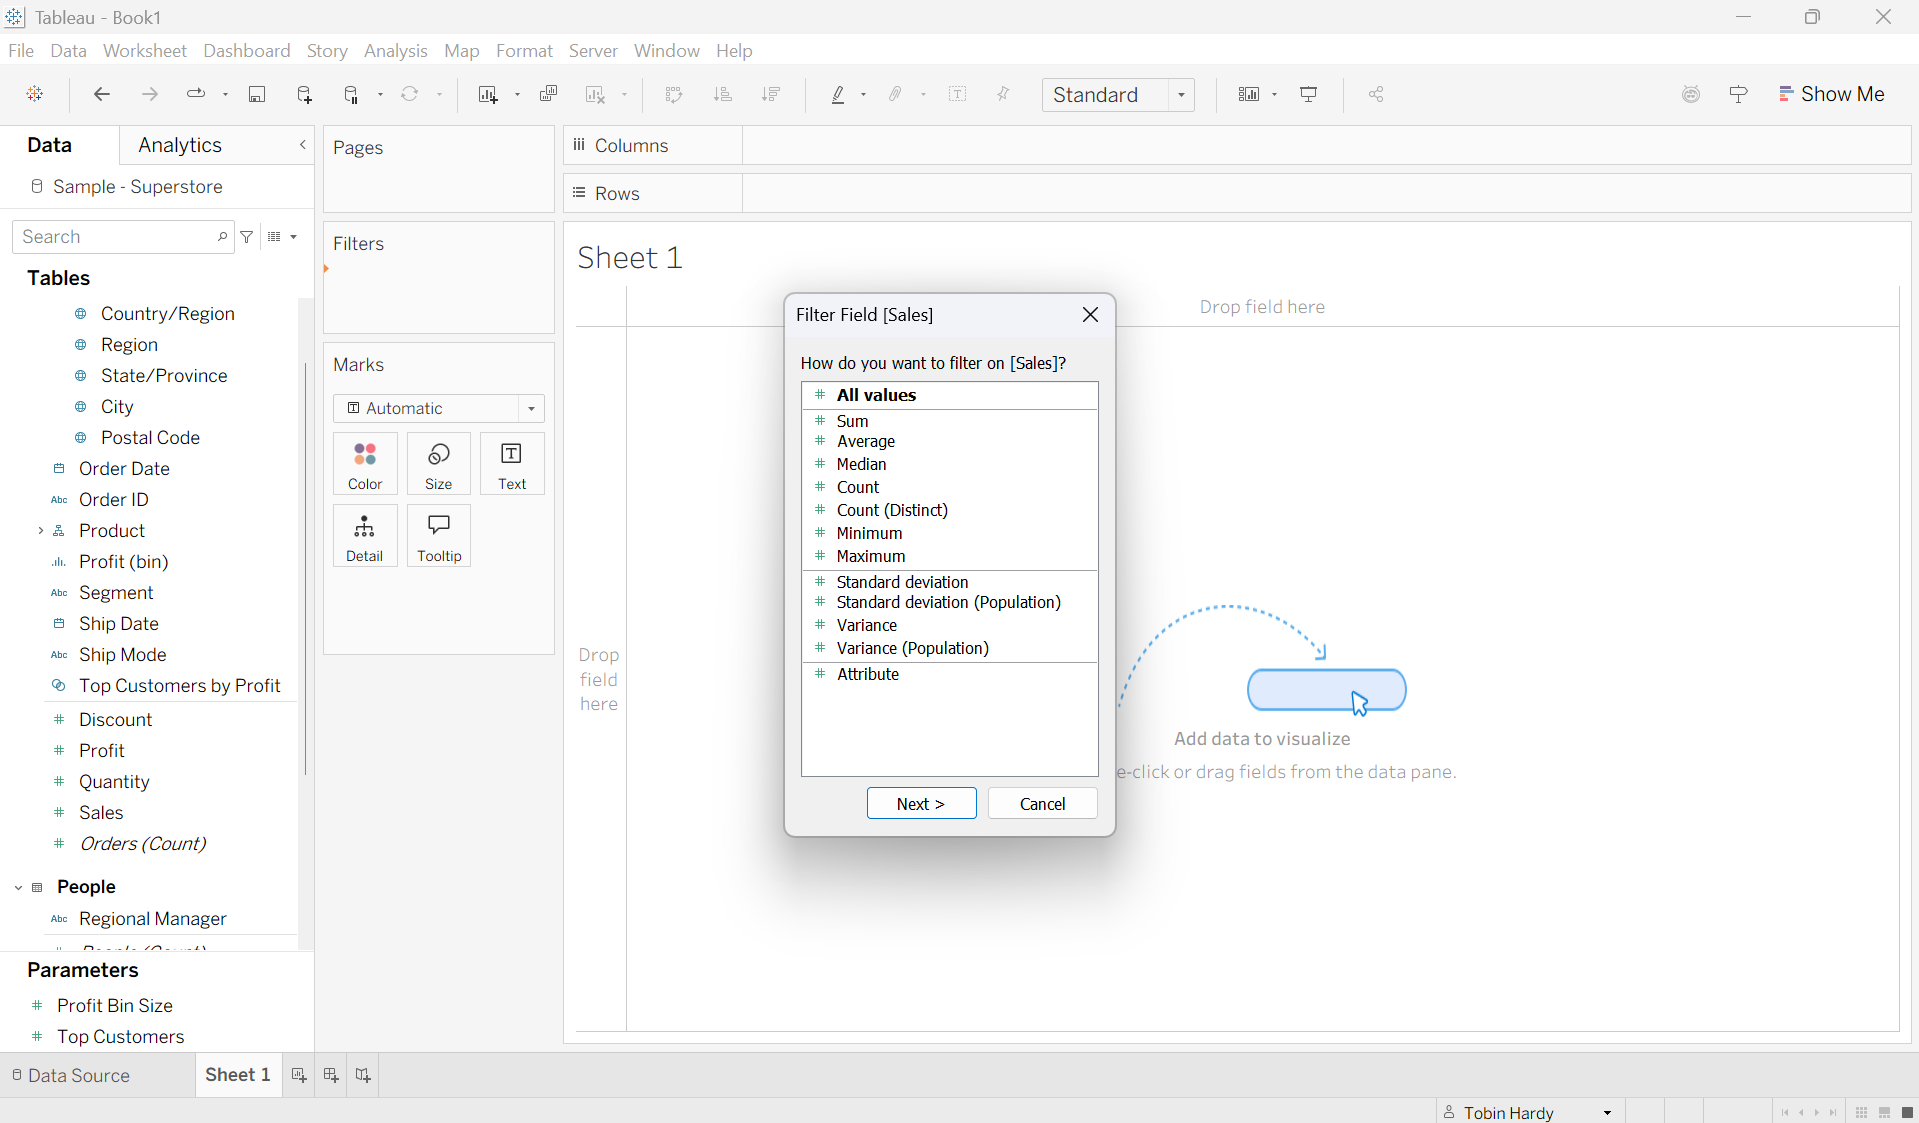
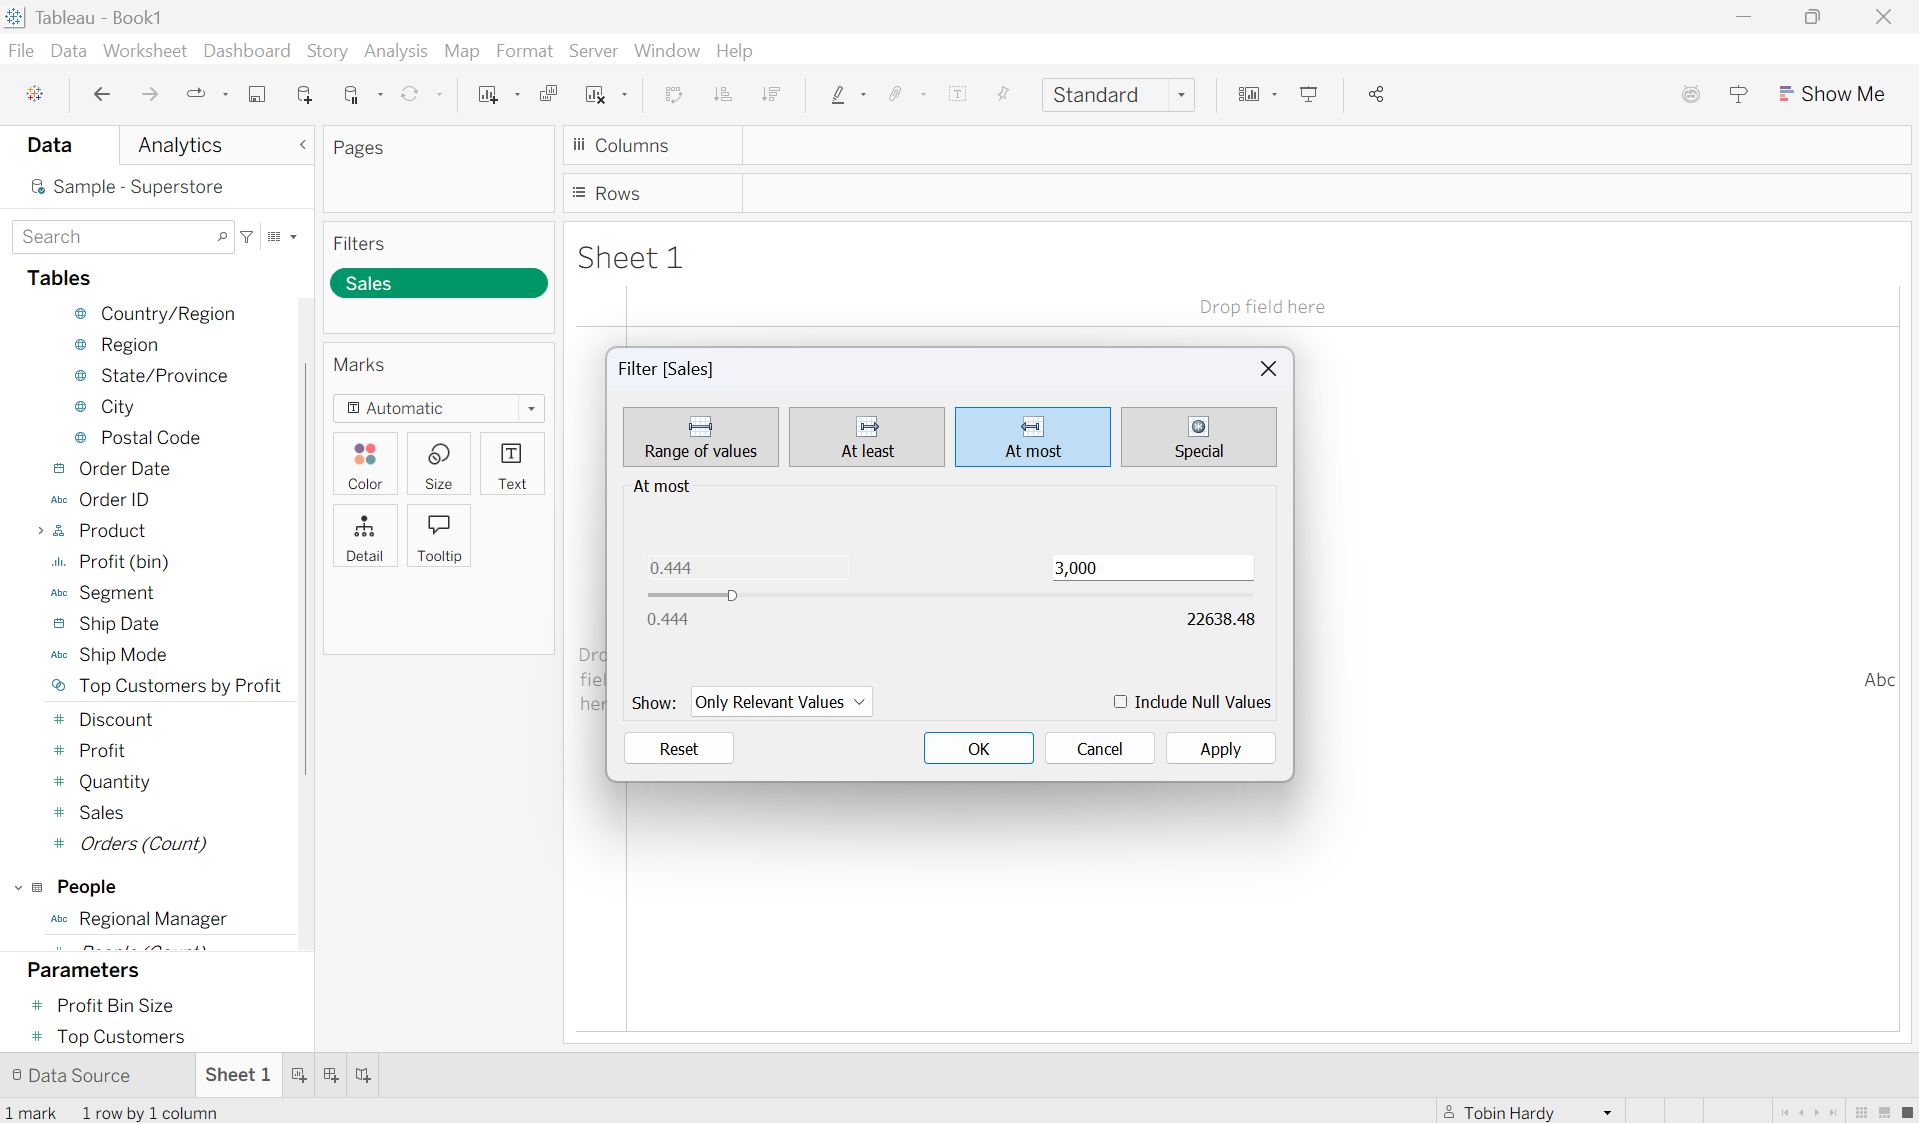
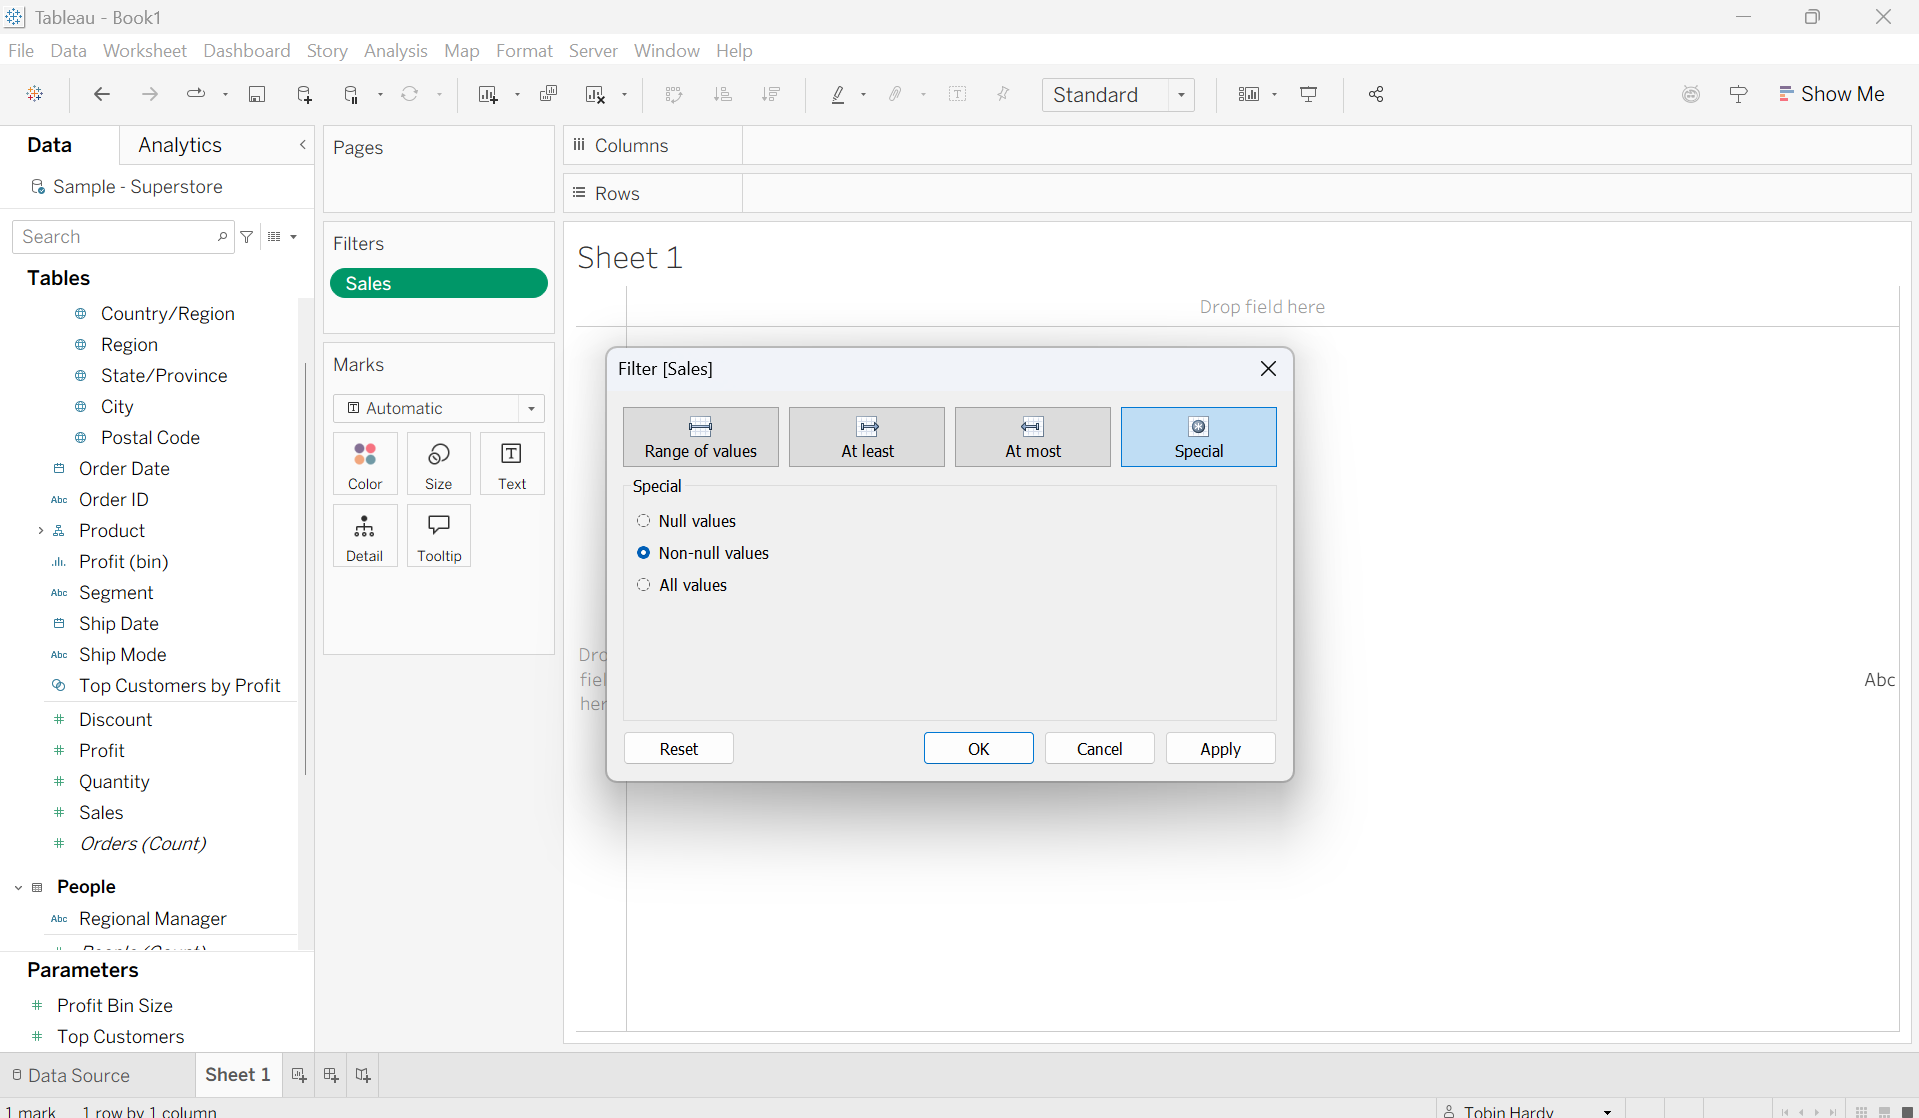
Green (Continuous)
Placing a green field on the filter shelf leads to a different text page asking how you would like to filter the data based on an ‘Aggregation’ or on the ‘Raw’ data.
Choose ‘All Values’ to filter on the raw data. Choose your desired ‘aggregation’ to filter out items based on your aggregation choice.
Range of Values
This option allows you to filter out all values outside of your selected minimum and maximum values (range). For example, here I want to only include items with Sales between 3,000 and 20,000.

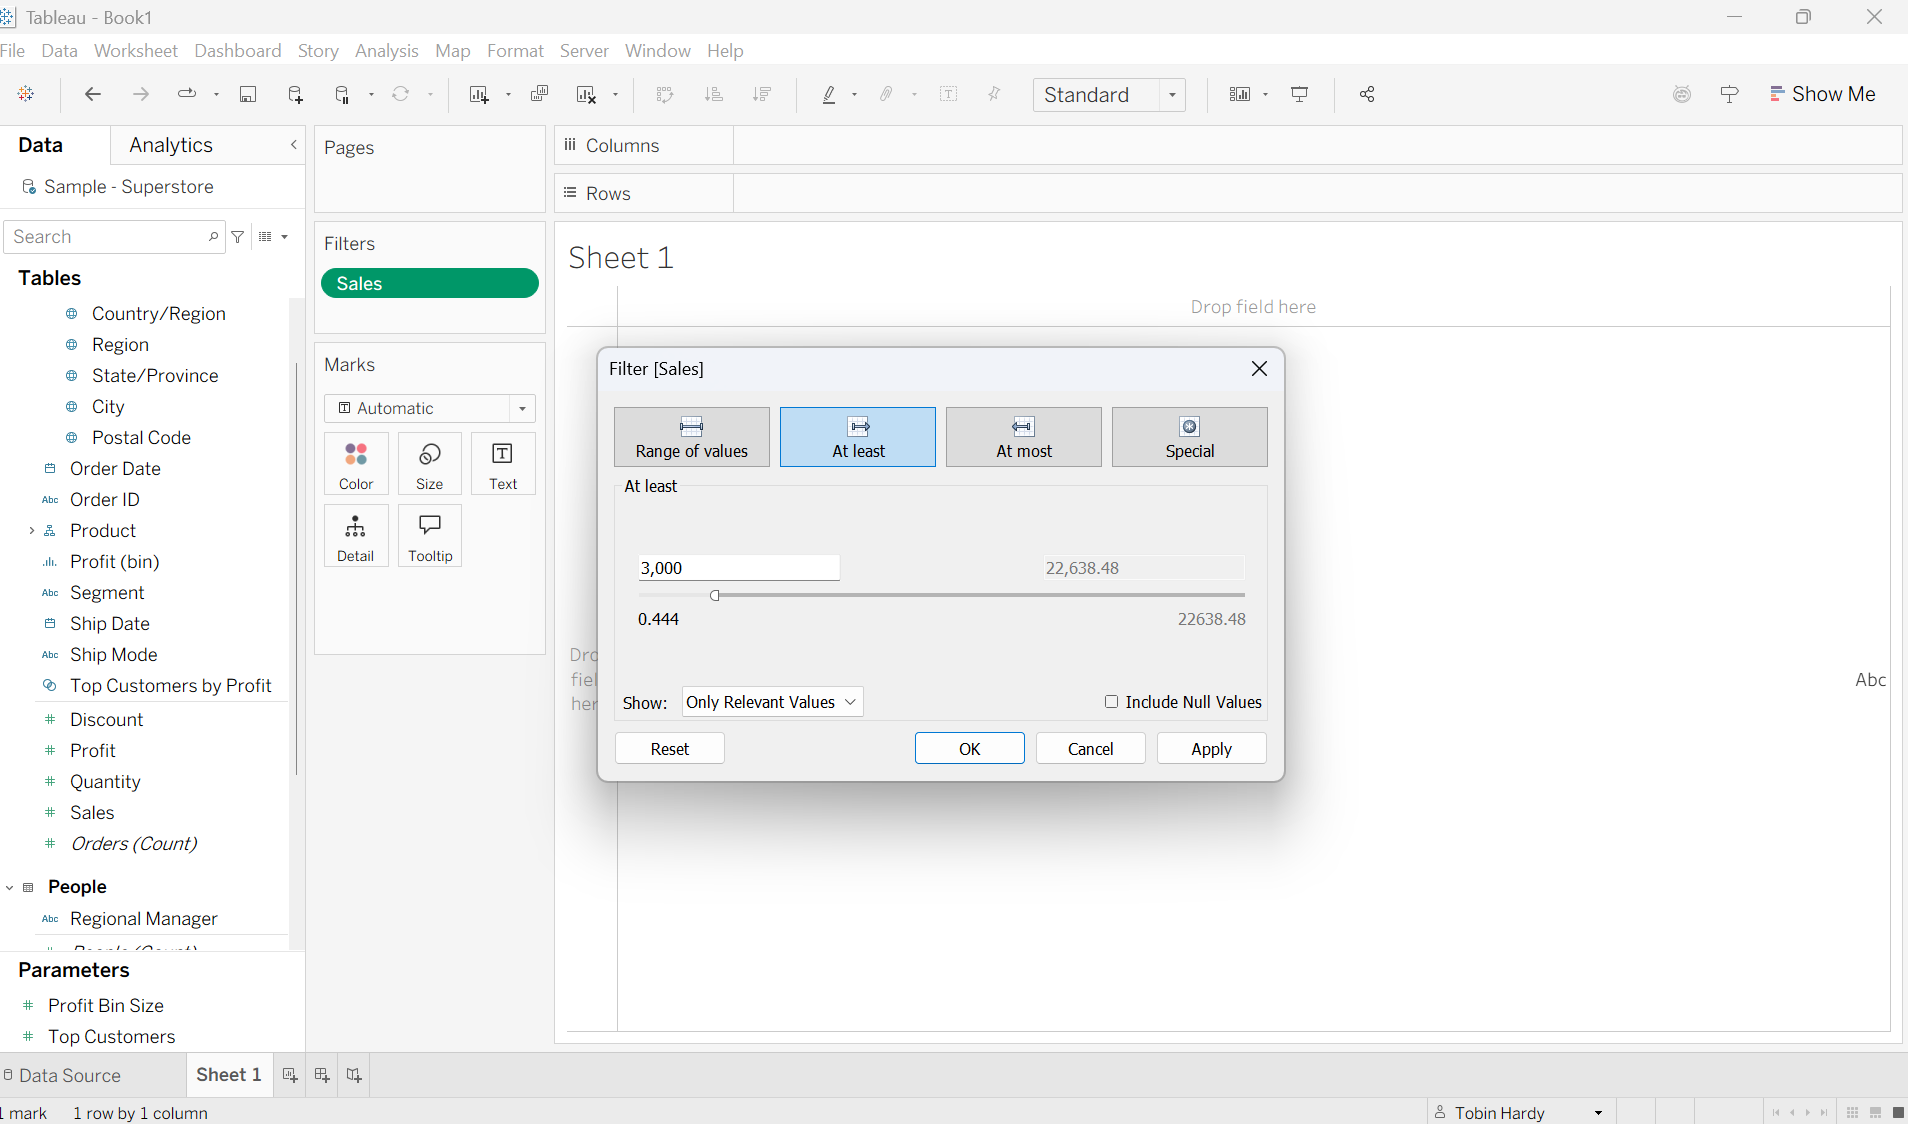
At Least
This filter function operates similarly to range, just with one tail. It allows you to filter out all values below a selected minimum. For example, here I am filtering out all sales below 3,000.
At Most
This function is the inverse of ‘at least’; it allows you to filter out all values above a selected maximum. For example, here I am filtering out all sales below 3,000. For example, now I only wish to look at sales which are 3,000 or less.
Special
Here you can simply select whether to include ‘All values’ in your data set or to either include null-values or exclude null values (Non-null values).
Green (continuous) filter overview