


In my previous blog I created a dynamic Top N report in Power BI (Link to that blog). However, that got my wondering how different/easier creating this same report would be within Tableau.
This blog is based on #WOW2025 W34
Firstly, lets create the base for our bar chart, which will simply include our products on the rows and our Sum of Sales on columns. With products sorted from most to least sales.
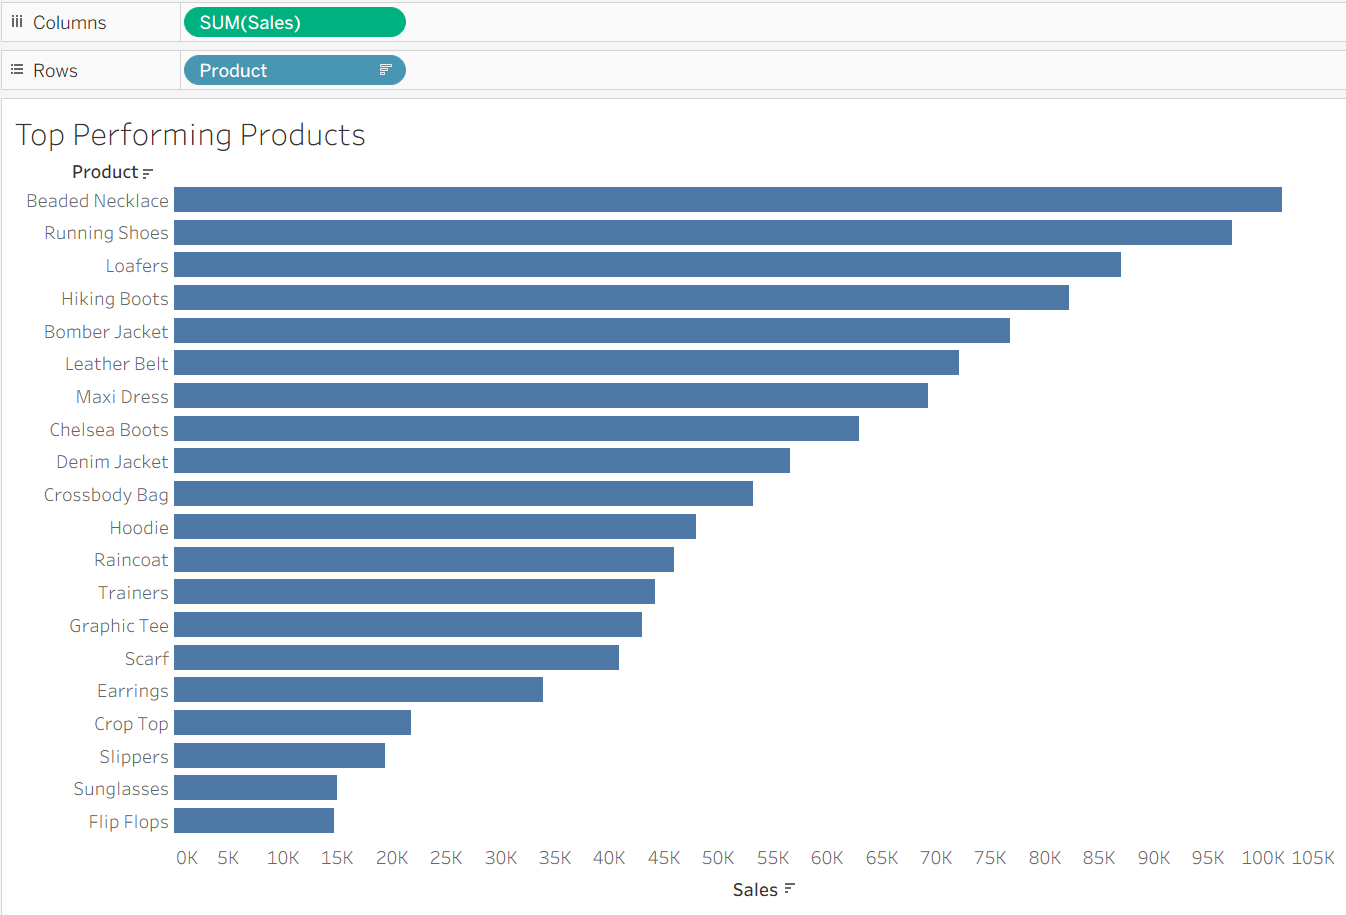
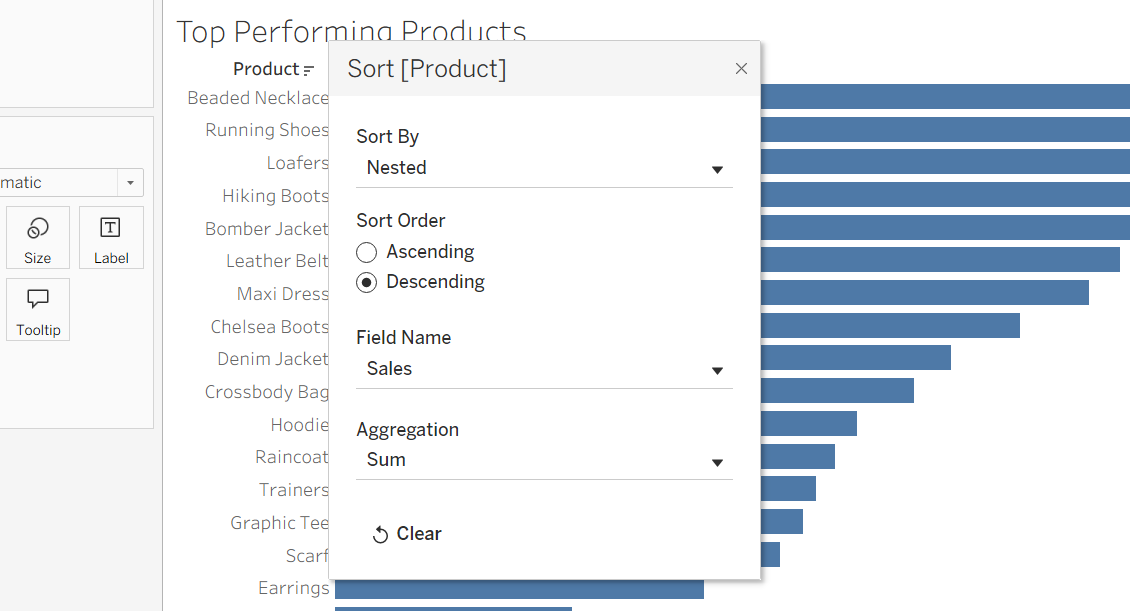
To sort in this manor we can click sort on Product -> nested -> descending -> sum of sales. Now our products will be sorted from highest to lowest sales.
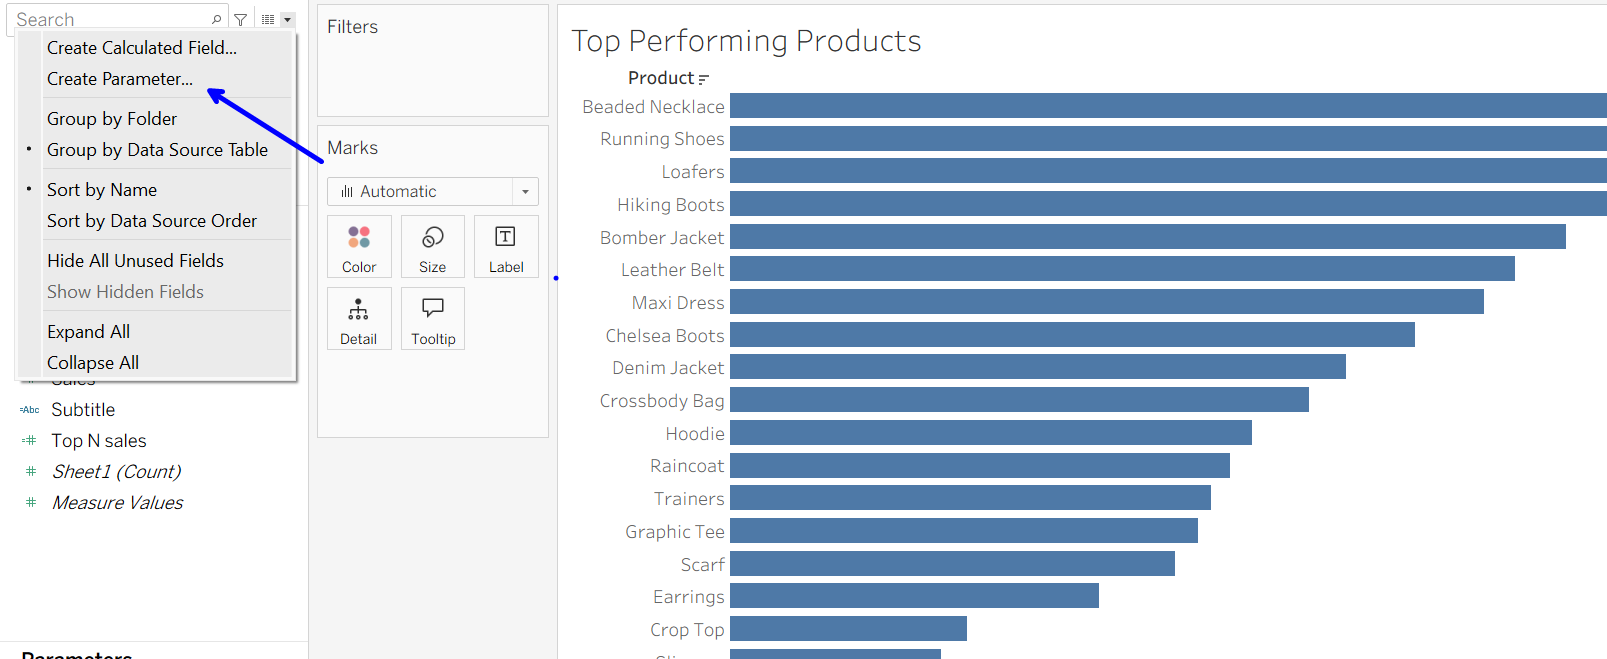
Now that we have our bar chart, we need to make our Top N parameter, which we'll use to colour our product bars later on.
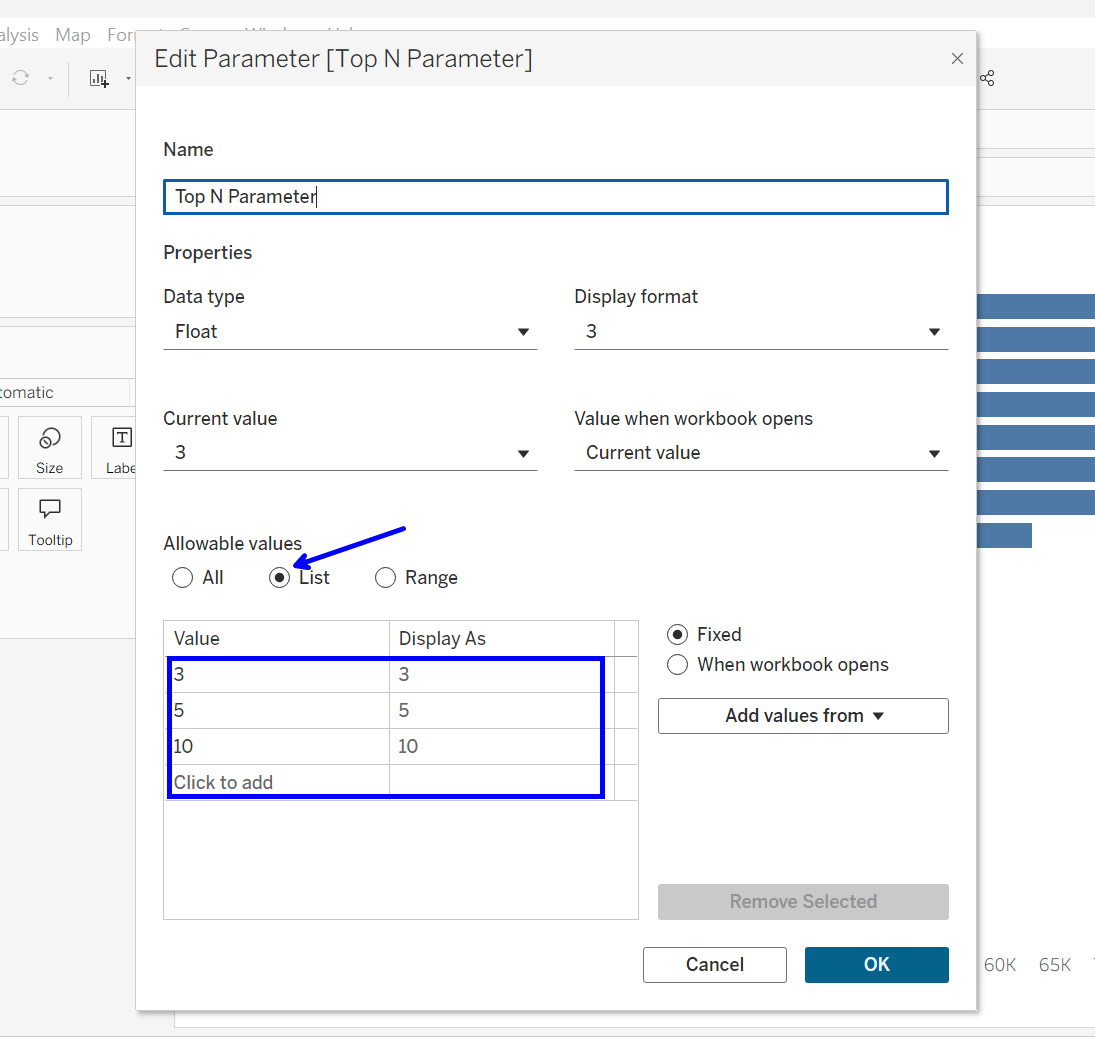
Lets call this parameter Top N Parameter and make it a Float value. Now we need to create the Top N values that we desire, for this report we want to have Top 3, Top 5, & Top 10.
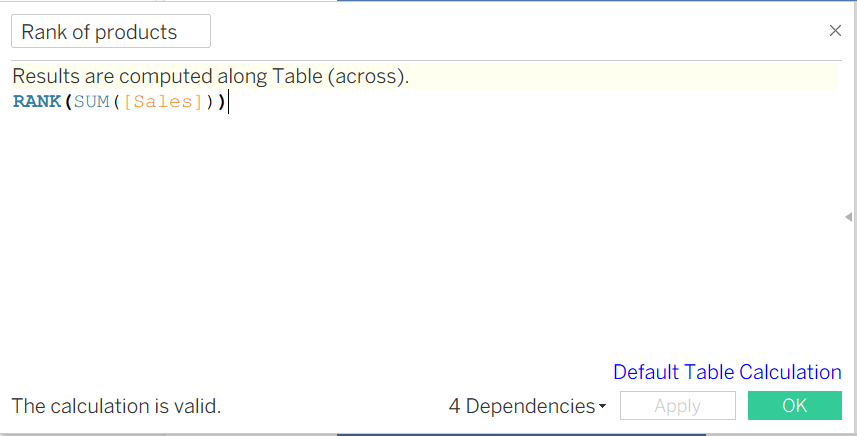
Now that we have our Top N values we need to assign our products a rank order, for out Top N values to correlate to later. This calculation will do just that.
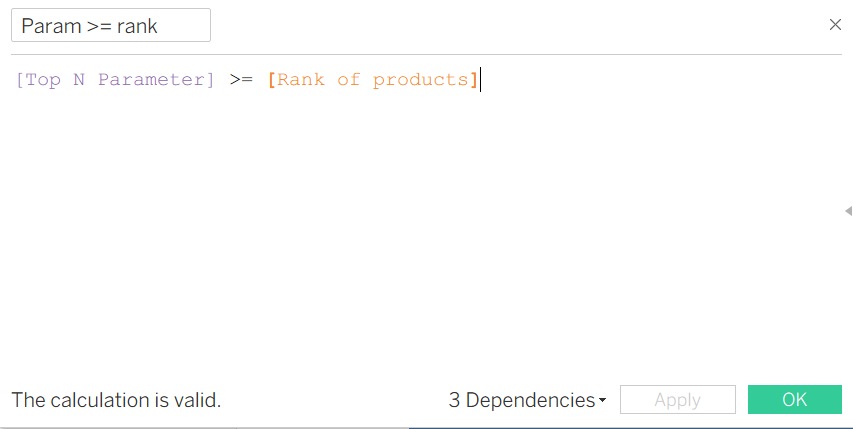
We now want to be able to colour all of our products that fall within our selected Top N value. To do this we want to create a calculation which equals true if our Top N value is >= to a products rank value.
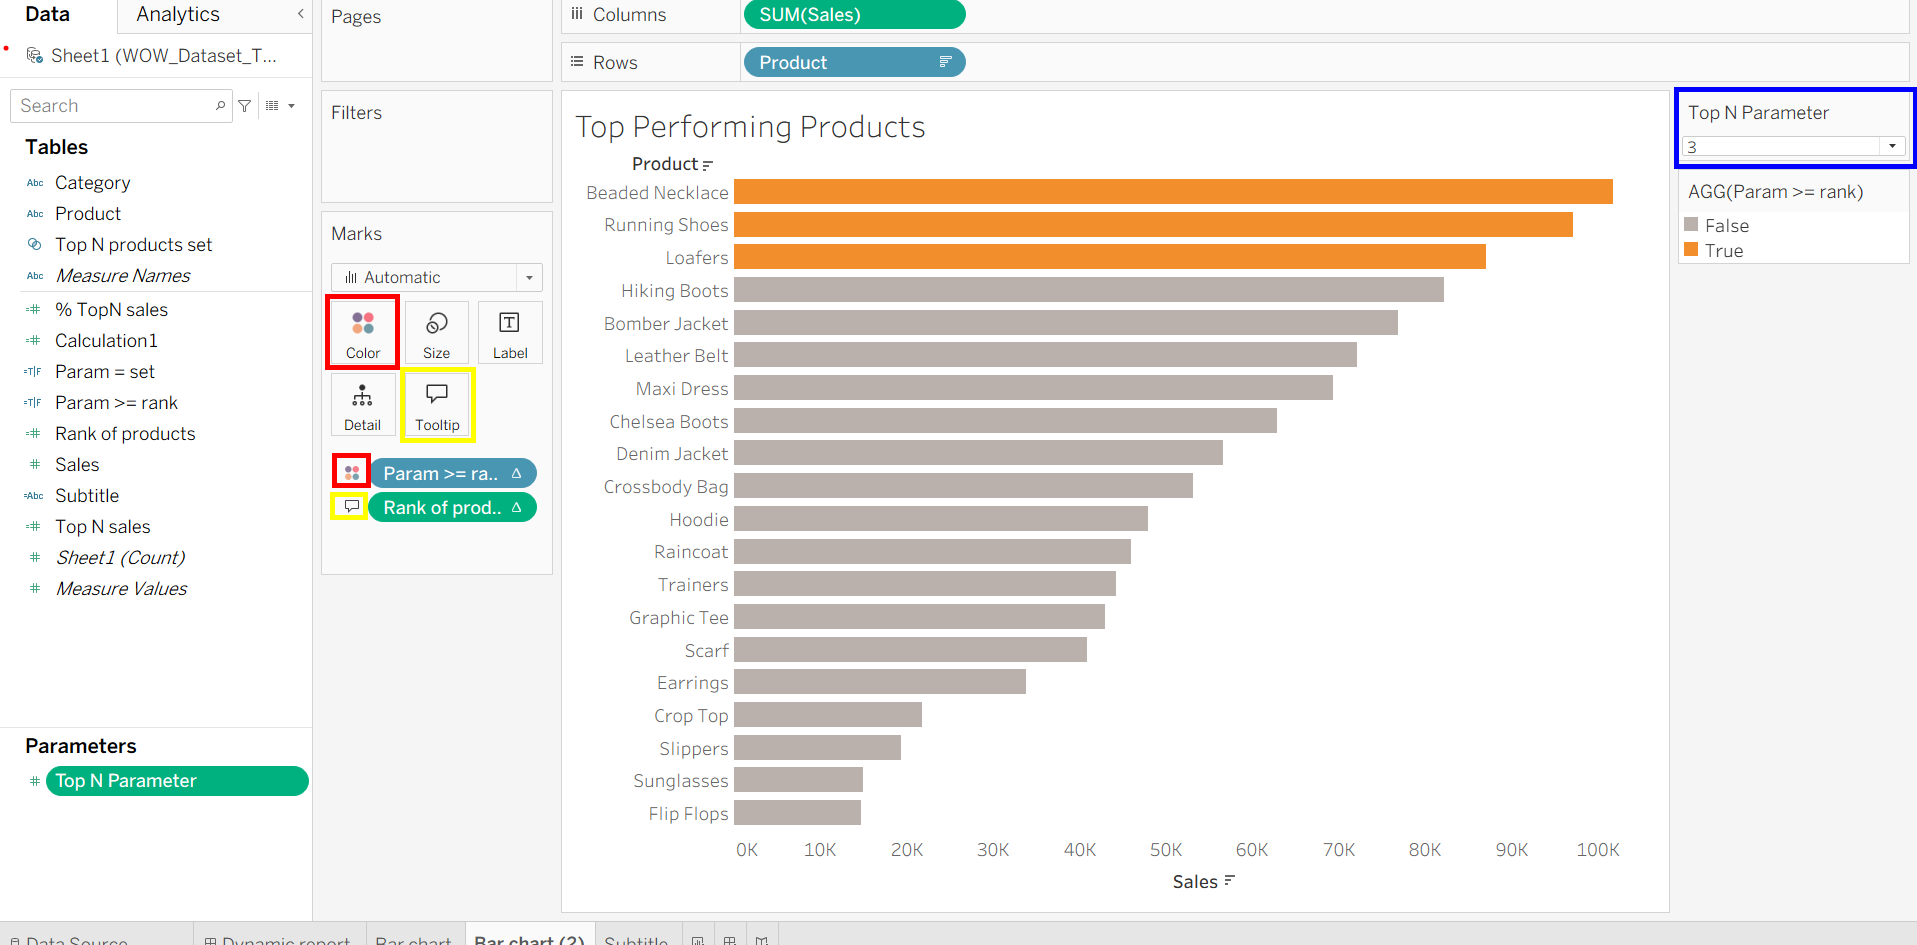
We can then place our Rank of Products calc on tooltips and our Param >= rank calc on colour. Now our bar colours will update with our selected parameter value.
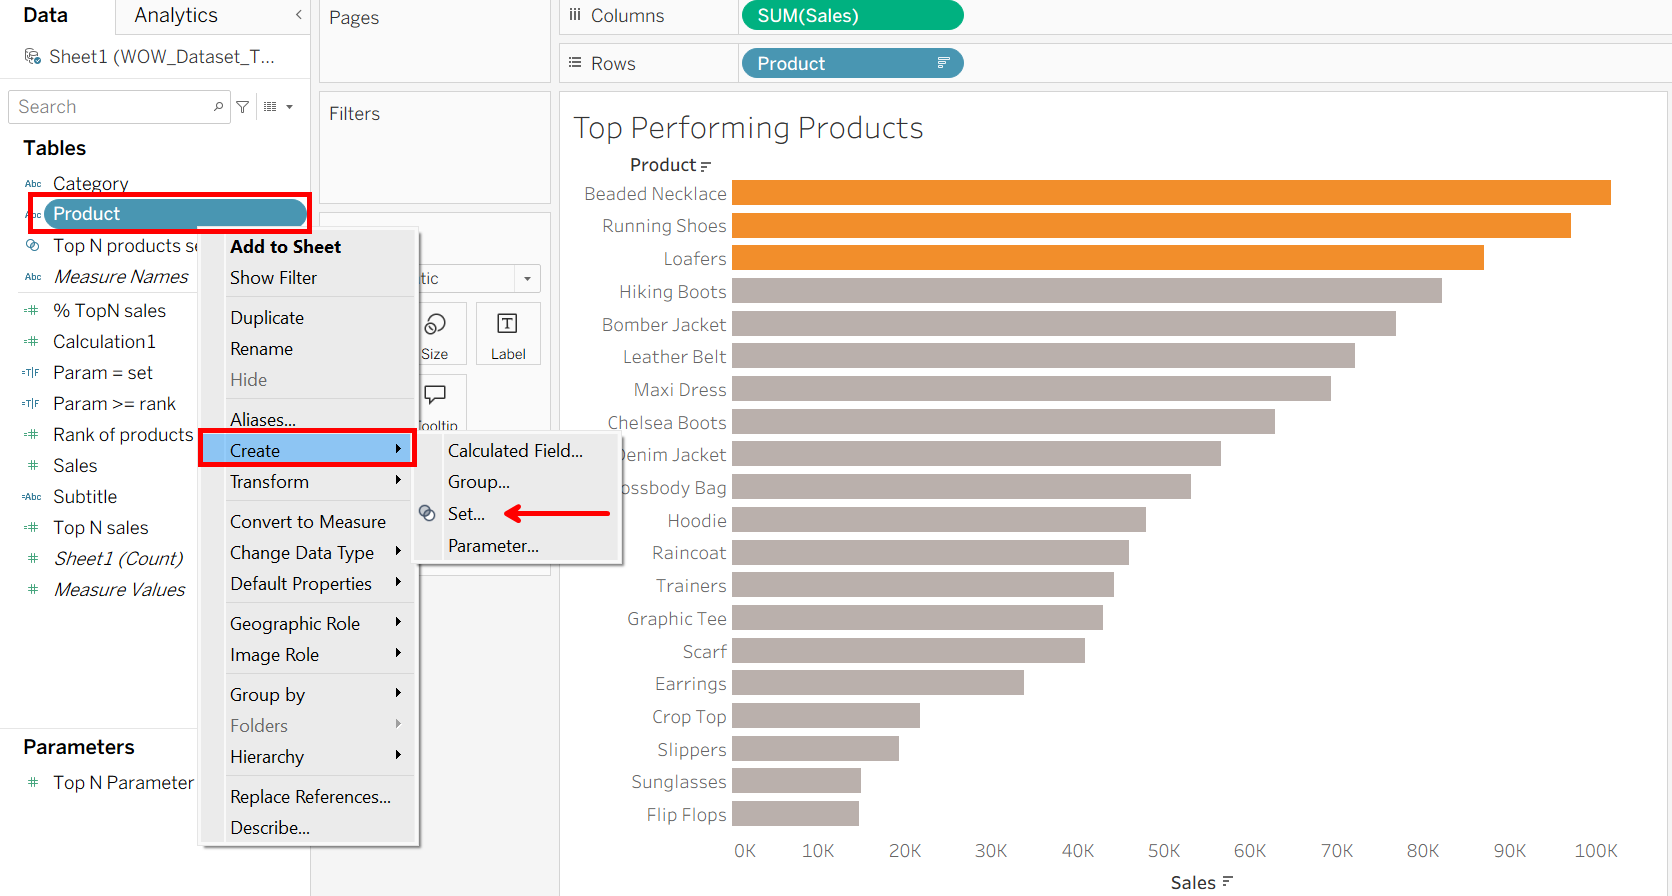
The next step is to assign all the products within our Top N range into a set. This will allow us to create our dynamic subtitle later on.
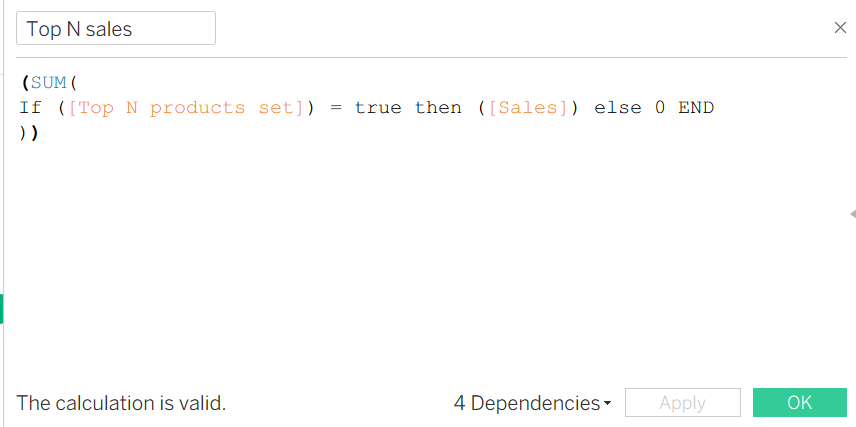
We can now work out the total sales for only the products within our Top N set using the calculation below.
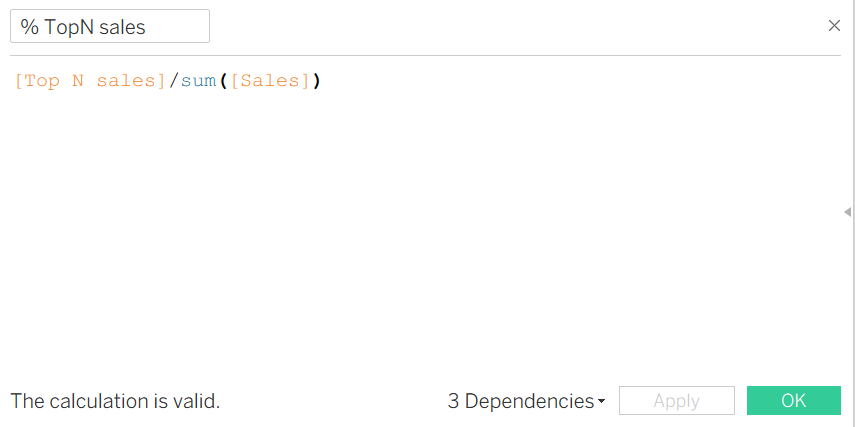
Next, we also want to calculate the % of total sales that our Top N sales makes up.
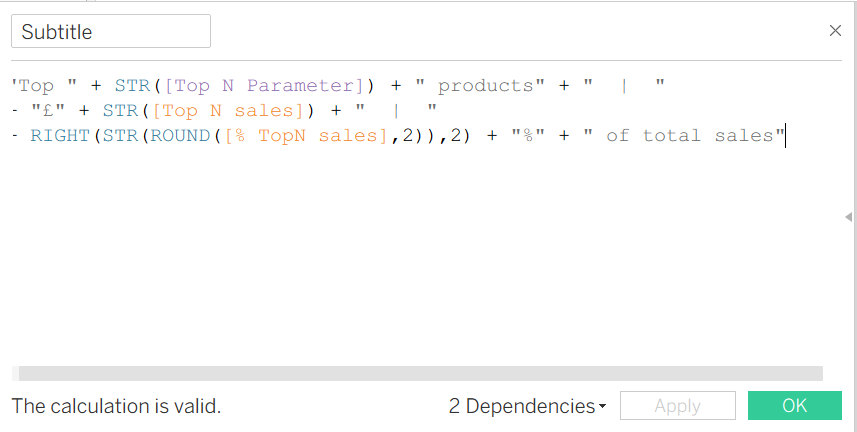
We now have all the calculations and values needed to create our dynamic subtitle. However, to do this we need to create one large string value which also formats our values to our desired manner. In this example we have rounded our % Top N sales to two decimal places and then used the RIGHT function to only return the two right most values. This formatting will allow us to turn our % TopN sales value into an actual percentage within our subtitle. It is important to remember that all of our numeric values need to be wrapped in the STR function to turn them all into string values.
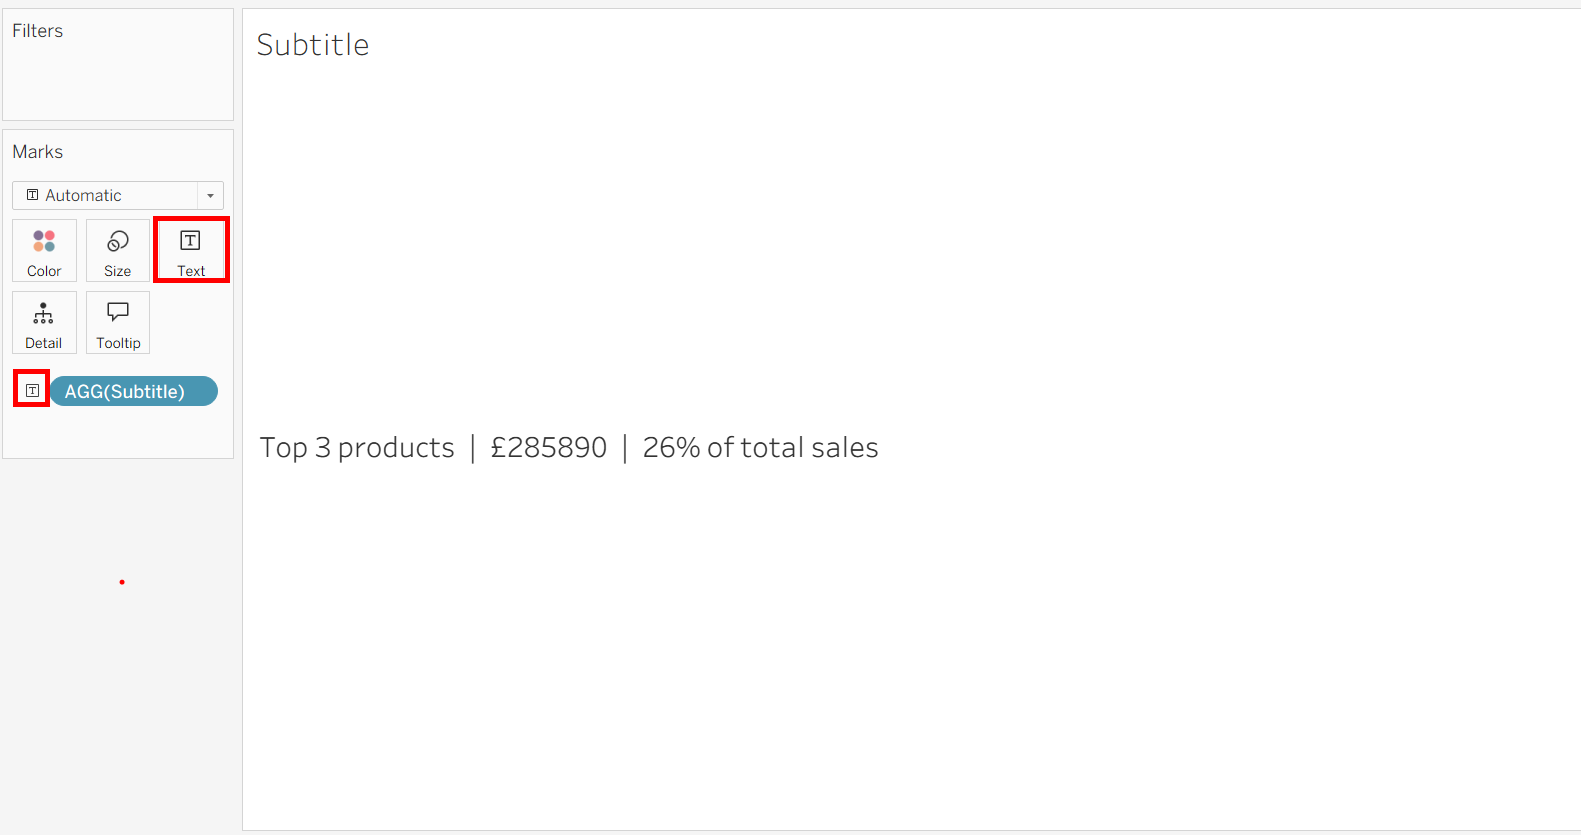
We can then add this dynamic subtitle into a separate worksheet before adding everything into our final dashboard.
Final Dashboard
