


Parameters can be a really useful tool within Tableau Prep as they allow you (or other users) to quickly explore different scenarios without needing to rebuild your workflow. In this blog, I will look at how we could use parameters so that the user can control the bucket (bin) size of a grouping.
The example within this blog was inspired by Preppin’ Data 2024: Week 8 - Prep Air Loyalty, which can be found here.
Let us imagine we've been tasked by an airline (in this case Prep Air) with analysing how two potential customer loyalty schemes might impact overall cost, as well as how many customers might benefit from each option.
Prep Air are considering the following two loyalty schemes:

In essence, the airline could either implement:
- 7 tiers, where customers move up a tier for every 5 flights taken per year, or
- 4 tiers, where customers move up a tier for every 10 flights taken per year.
First, let’s set up our parameter.
Screenshot of what the parameter set up should look like.
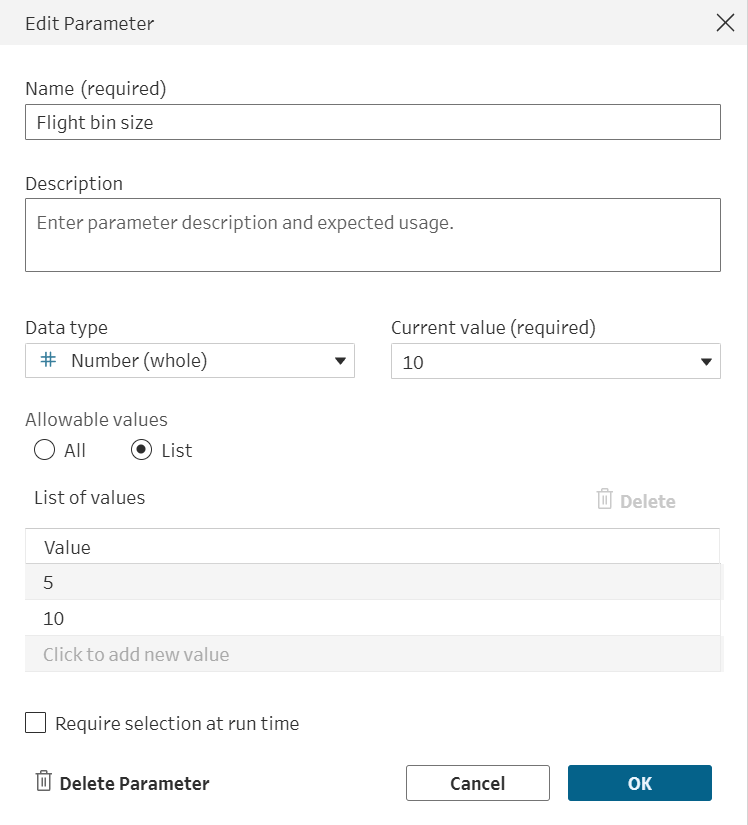
Within the Edit Parameter dialog box we need to:
- Give our parameter a name such as “Flight bin size”
- Change our data type to # Number (whole)
- Change Allowable values to List
- Enter the bin sizes we want to compare. In this case 5 & 10.
Now we are ready to see how this parameter can be used within our workflow.
In this example, we will be able to use our bucket size parameter in two ways:
- As a filter to control which loyalty scheme is shown in the ‘Prep Air Loyalty’ table.
- Within a calculated field in a ‘Prep Air Customers’ table, assigning customers to a tier based on their estimated number of flights per year.
Using the bin size parameter as a filter
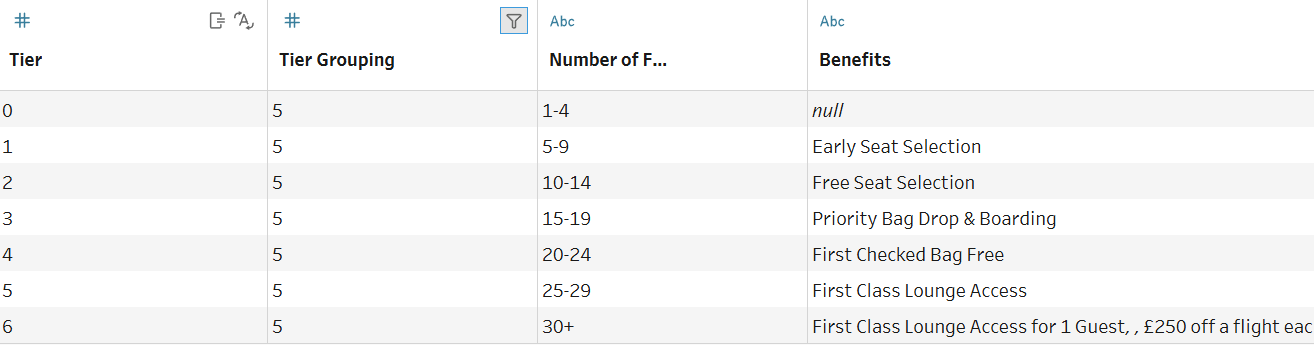
This is what our potential loyalty schemes currently look like:
At the moment, the table shows information for both loyalty options. However, if we only want to view the scheme we’re interested in, we can use our bin size parameter to filter the table.
To do this:
- Click:
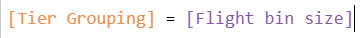
- Then write a calculation linking Tier Grouping to our selected parameter value:
Now with a simple parameter selection:
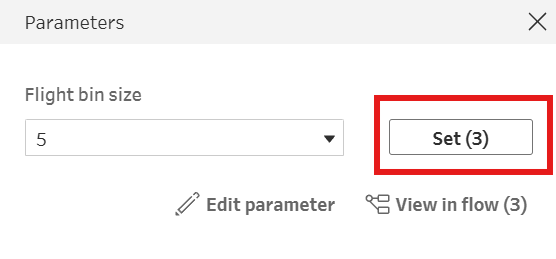
Screenshot
our table will automatically update to show only the relevant loyalty scheme.
To create a dynamic tier field in our customer info table.
Next, we want to see which tier each customer would fall into based on their average number of flights per year.
To do this, we need to create the following calculated field:

In simple terms:
- The calculation divides a customers estimated number of flights per year by the current bin size selected in the parameter
- The FLOOR function then rounds this value down to the nearest integer (e.g., 3.14 becomes 3)
Because this calculation references the parameter, changing the bin size immediately updates each customer’s predicted tier. This gives us the flexibility to analyse both loyalty schemes using the same workflow.
From here, we can go on to calculate the yearly cost of each tier and the number of customers affected under each system — but I’ll leave that for you to explore in Preppin' Data 2024 Week 8.