


Creating a Splicer from Measures in PowerBI
Hello Reader,
So, you’ve come from Holly Jones’ blog post (https://www.thedataschool.co.uk/holly-jones/creating-parameters-in-powerbi-desktop/) about creating a parameter so toggle between different dimensions and now you’re wondering if the same can be done for measures?
Well, it can.
In-fact, I needed this very solution for a Makeover Monday on PowerBI.
The Measures I will be creating a parameter on are MEN & WOMEN on surveyed on washing their hands after using the toilets.
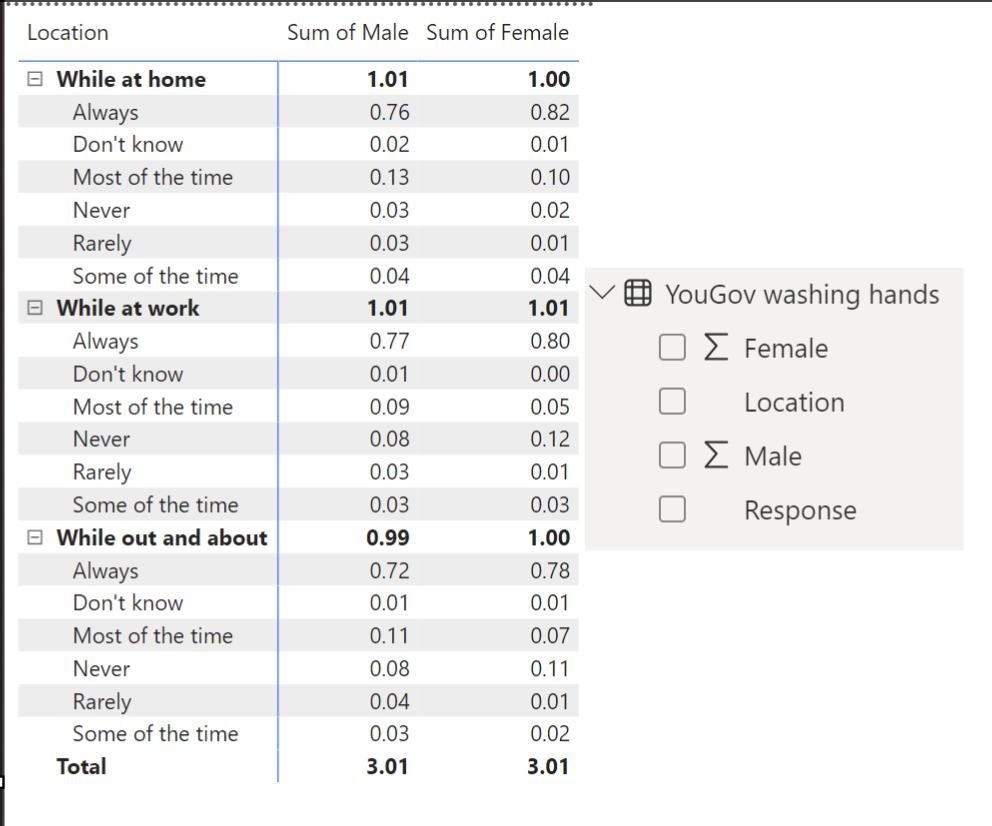
Though it is a similar journey to creating the splicer for dimensions there is a step that must be taken first, we need to create a very basic DAX expression on our Men & Women to create the Total Men & Women.
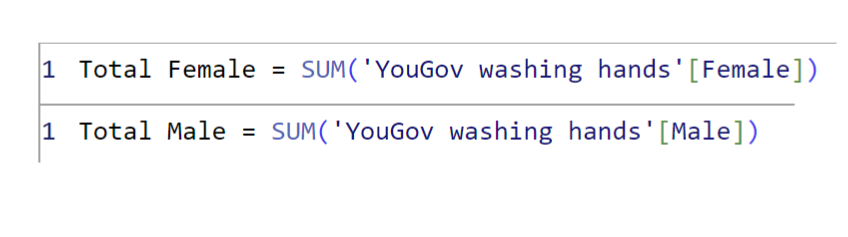
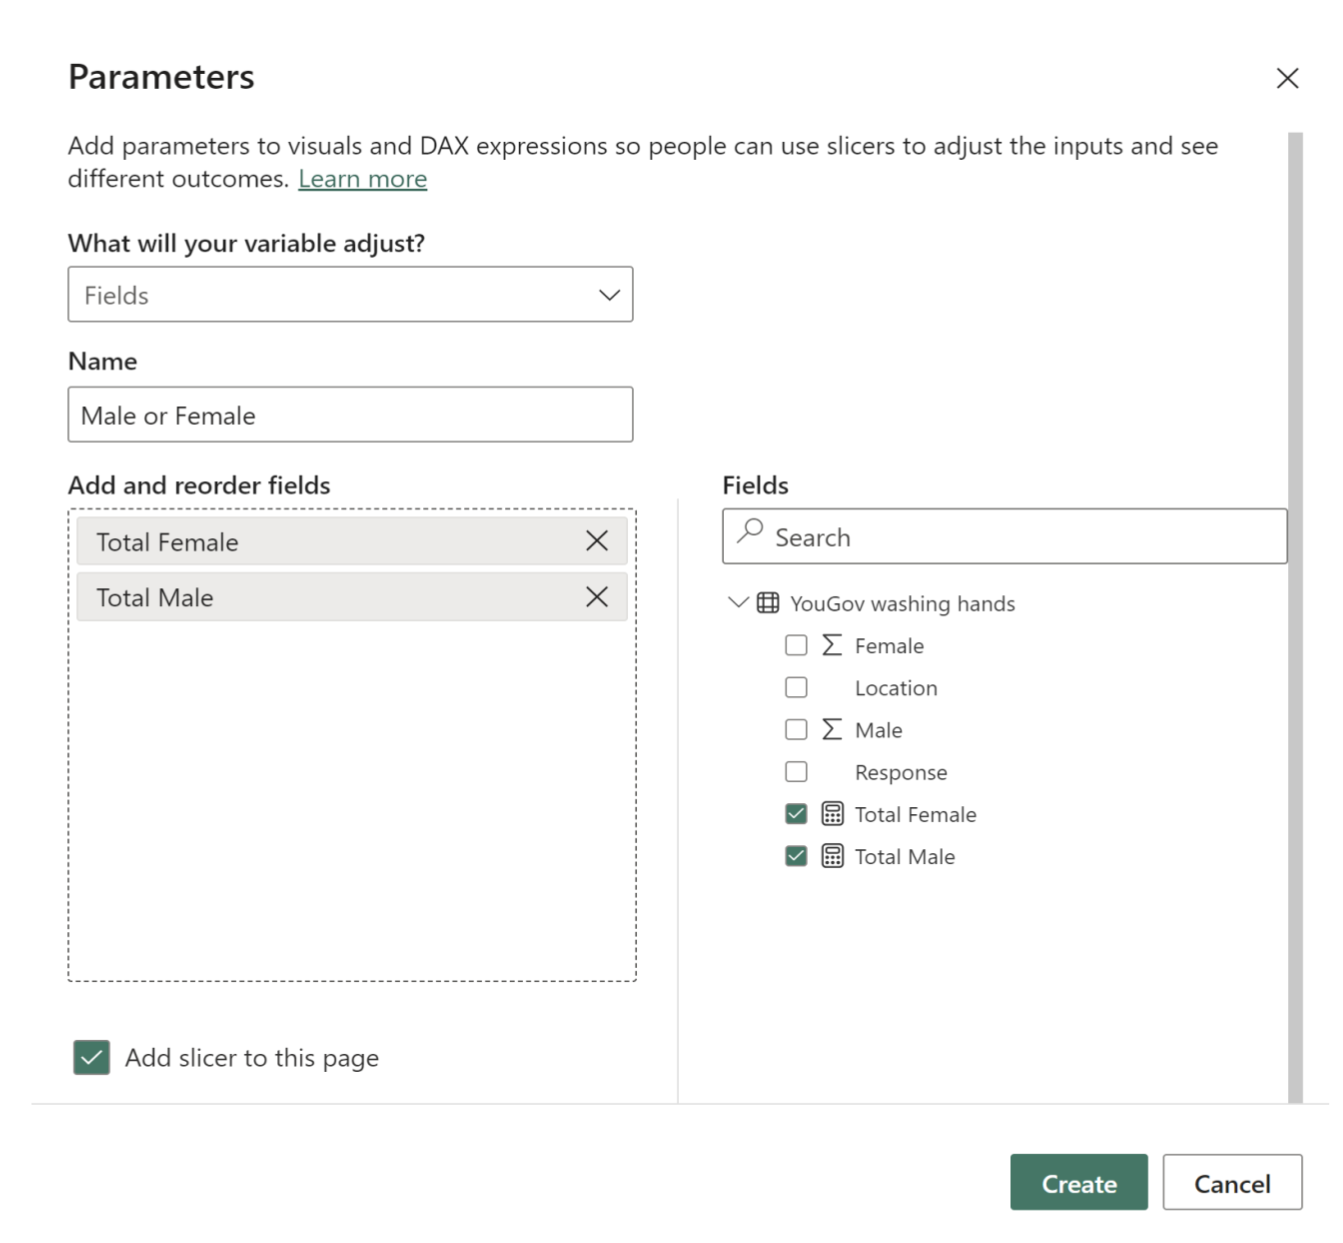
Now that we have these two values, we can use them in our Parameter:
Now we add the value from the Parameter into the visualization we want to use:
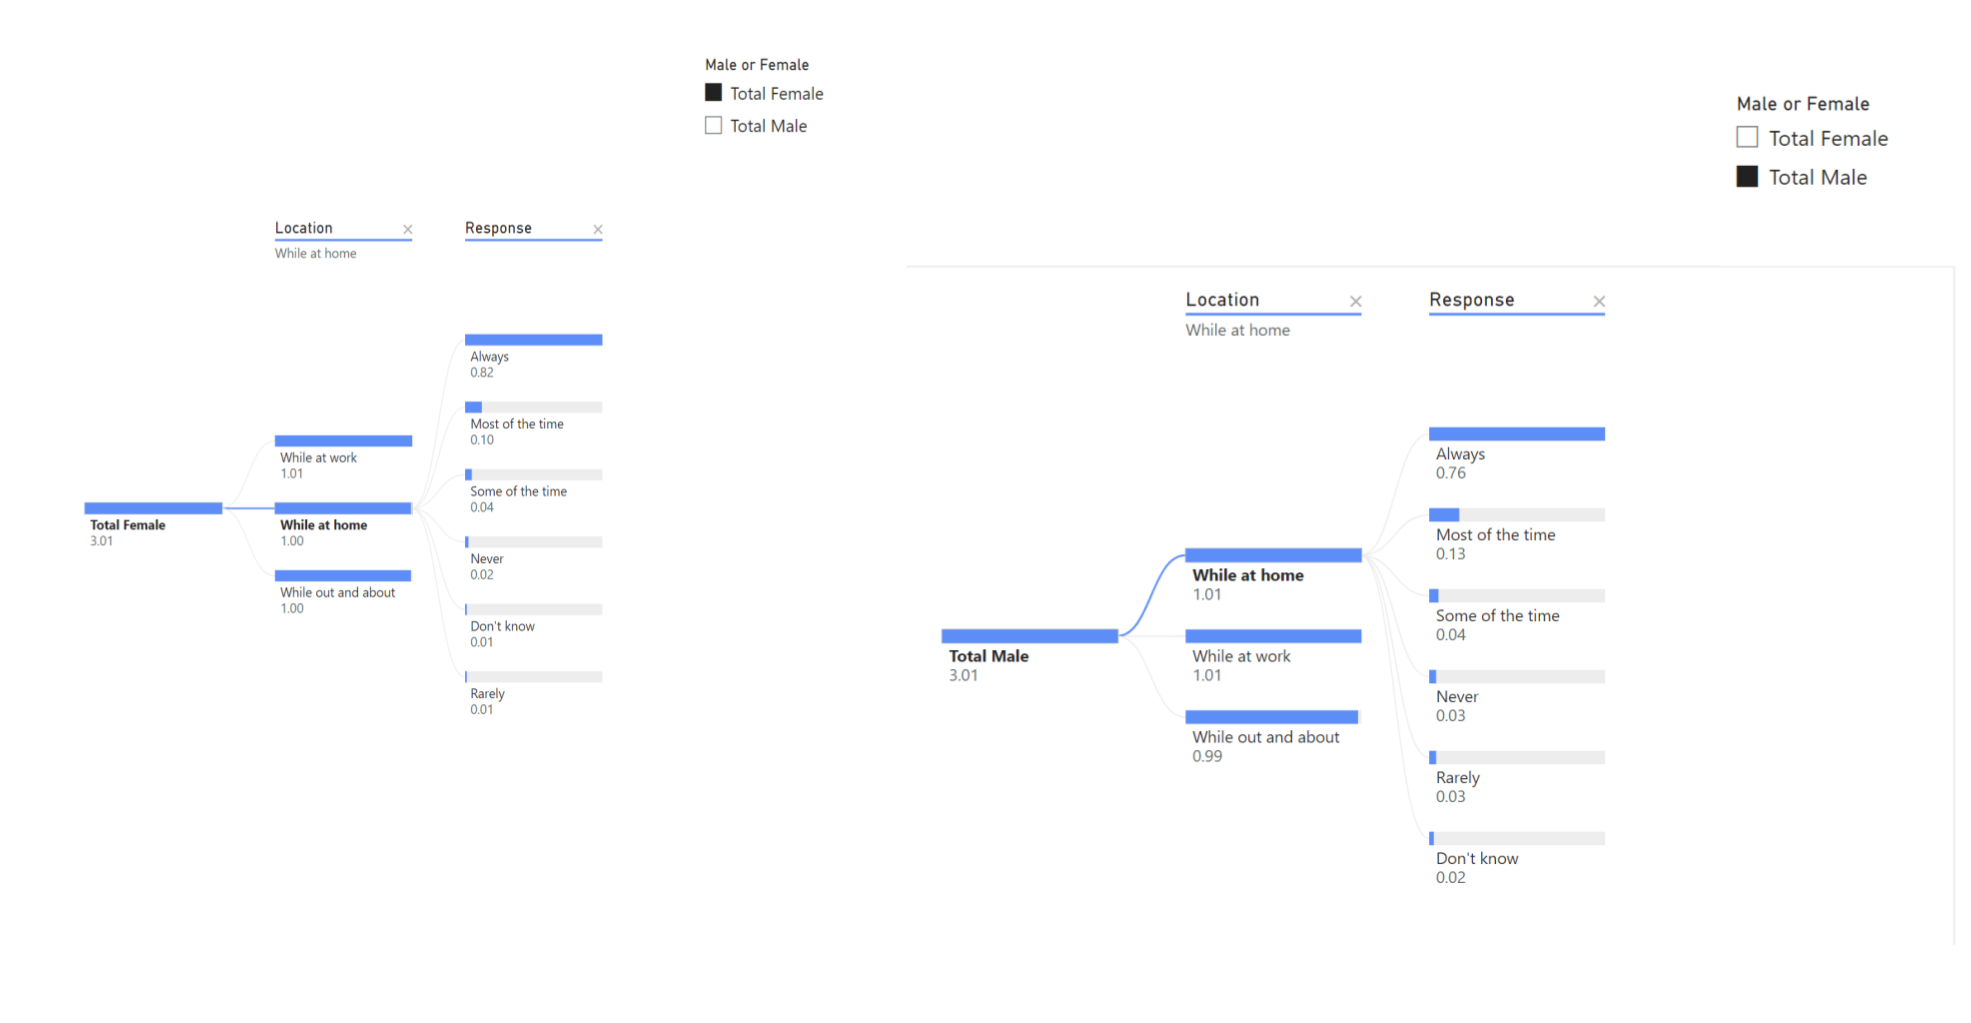
in this instance a decomposition tree – which will now filter in-between Male or Female because of the Splicer we made.