


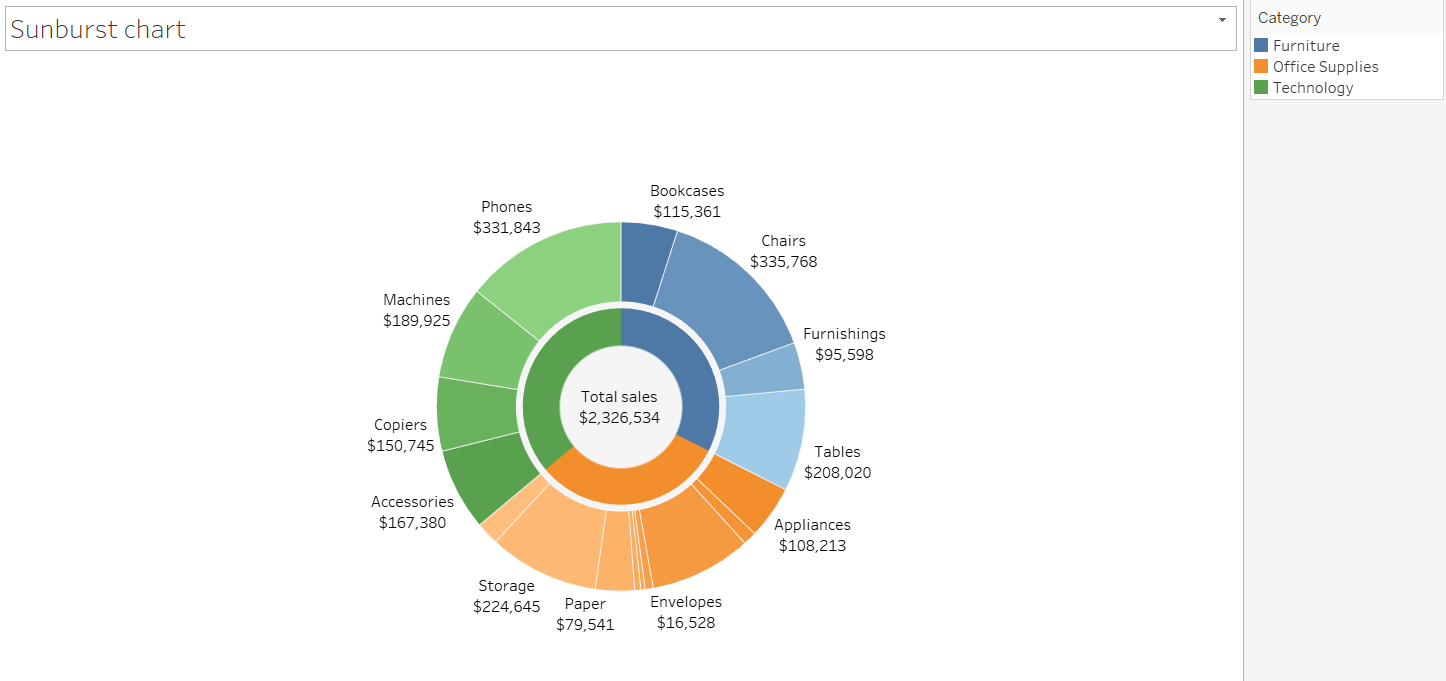
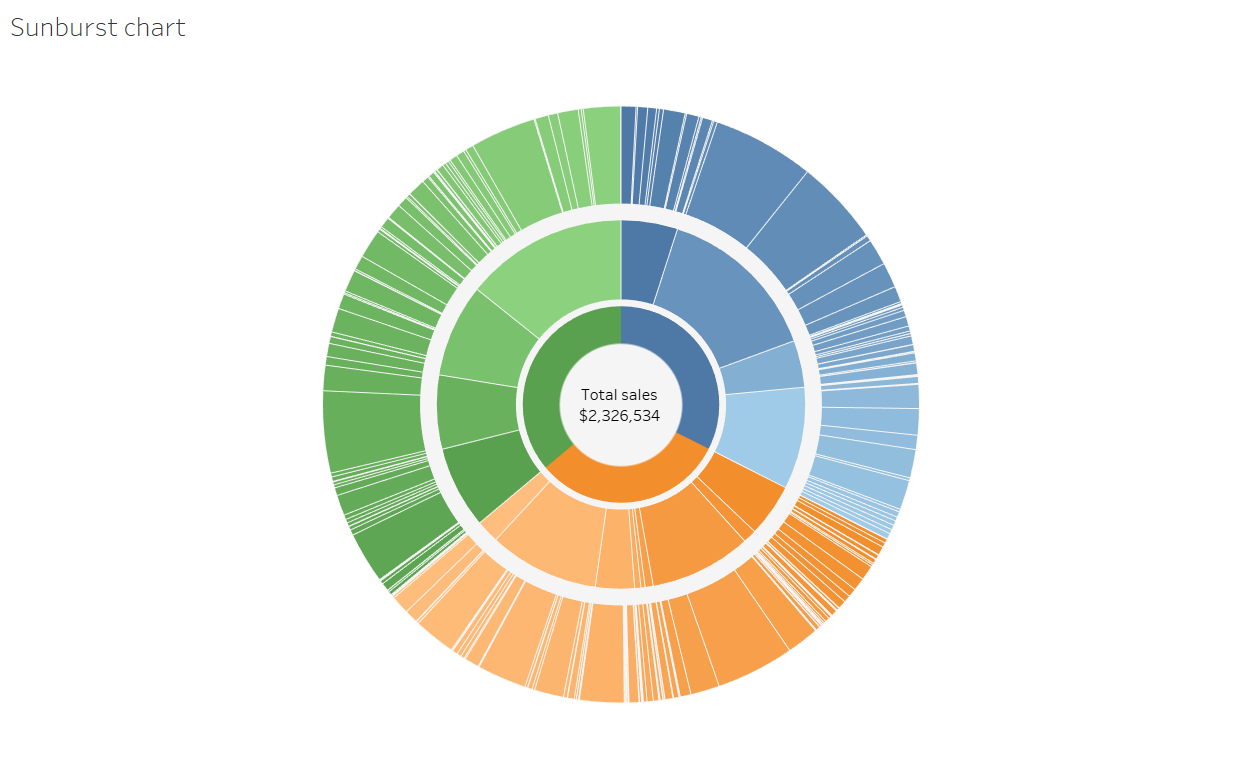
Ever wondered how to visualise hierarchical data in a visually striking way? The sunburst chart is a fantastic choice. It’s designed to display hierarchies, where each level is represented by a ring or circle. The innermost circle represents the top of the hierarchy, with subsequent layers breaking down the data into contributing components.
When used correctly, a sunburst chart effectively shows how the outer rings relate to the inner rings, making it an excellent choice for exploring relationships within hierarchical data.
Steps to Create a Sunburst Chart
Let’s dive into how to create a sunburst chart using the Sample Superstore dataset.
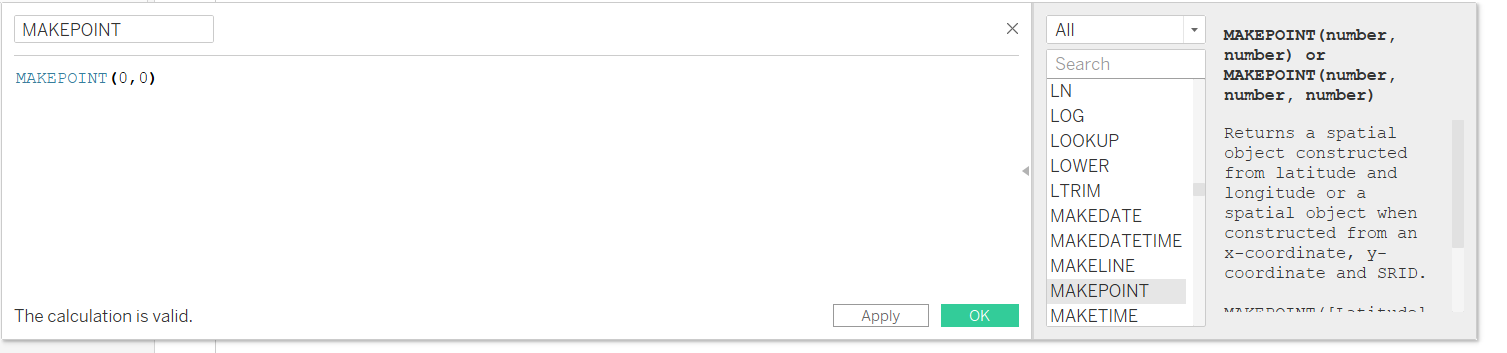
1. Use the MAKEPOINT Function
Start by creating a calculated field using the MAKEPOINT function. This sets the stage for creating the visualisation layers.
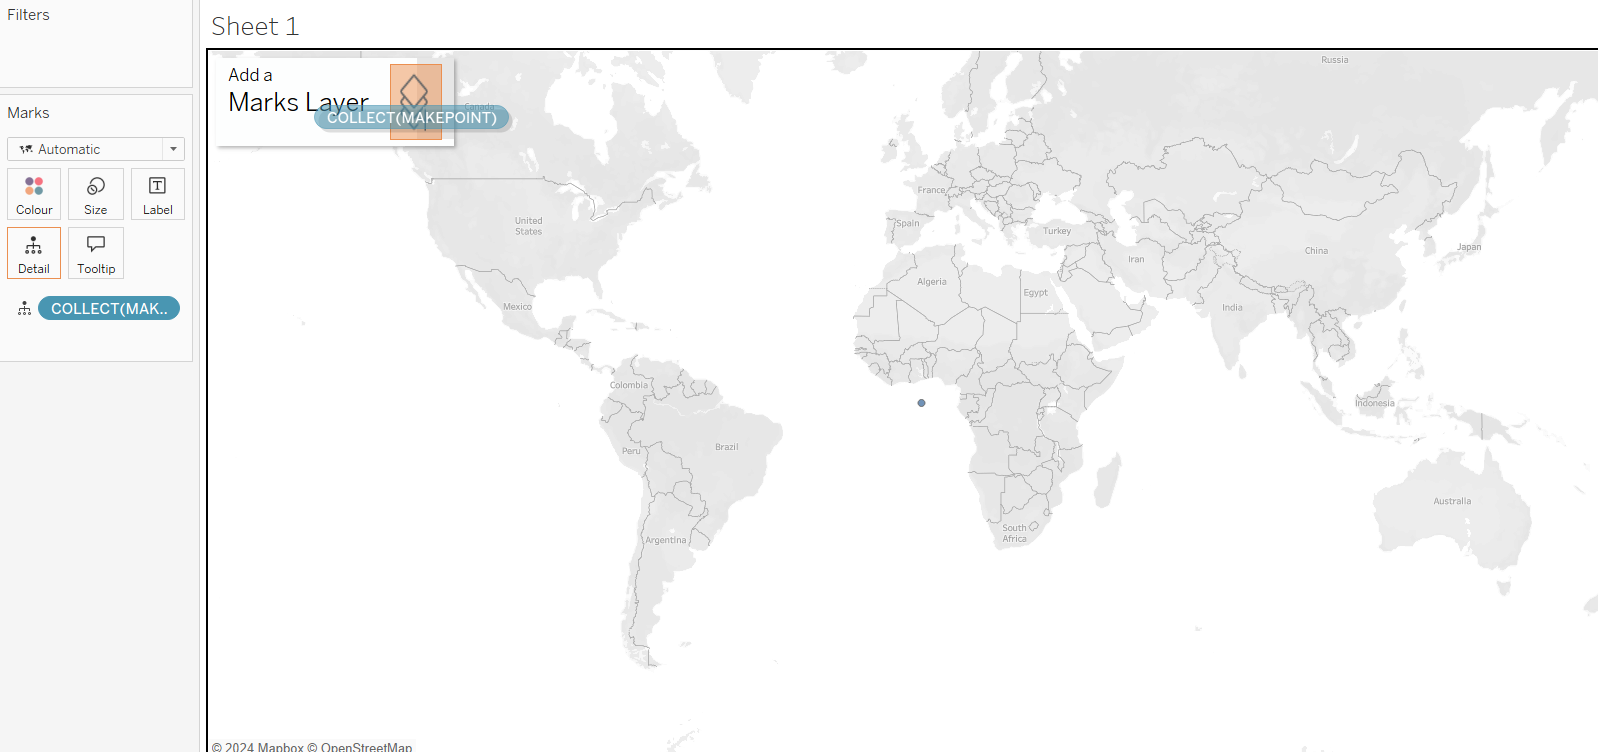
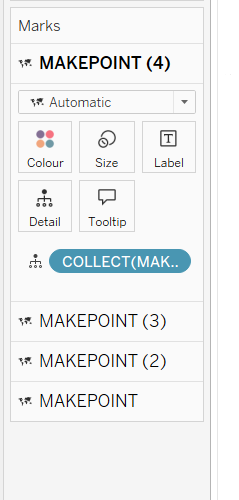
2. Add Layers to the Map
Drag the MAKEPOINT calculation into the view. This will automatically generate a map. Then, drag it four times onto the Map Layer.
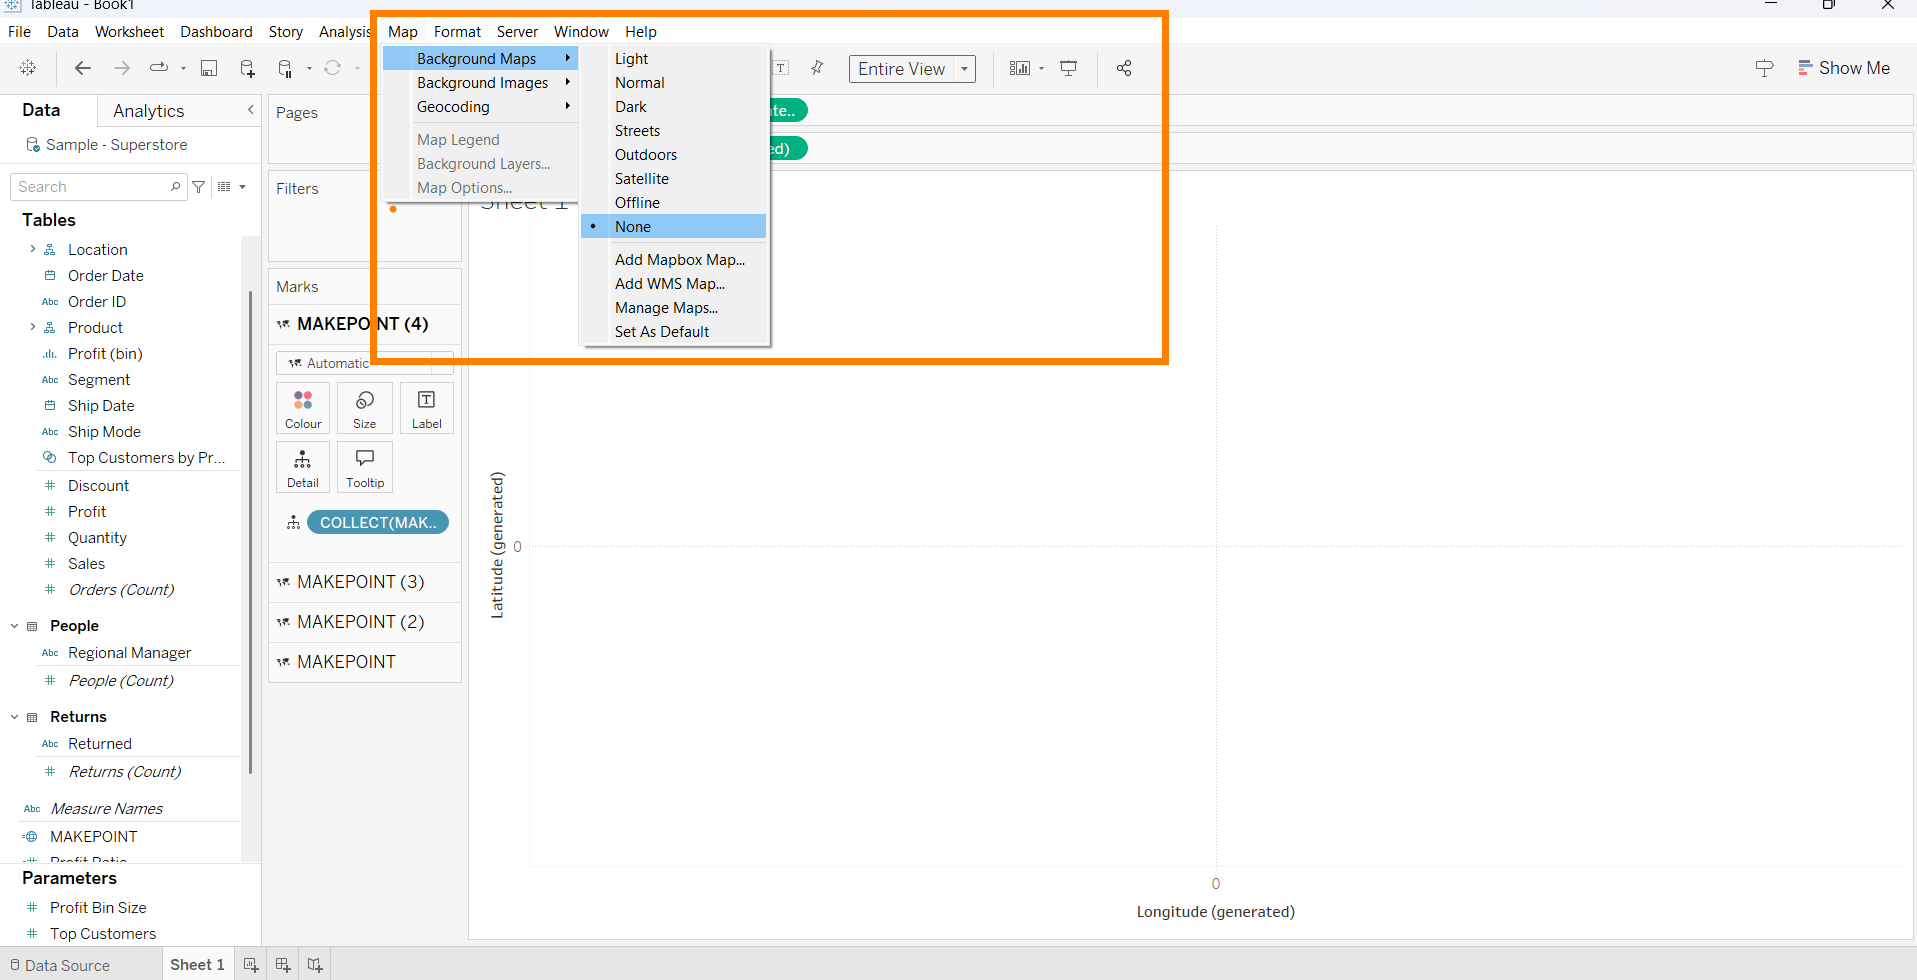
3. Remove the Background Map
To clean up the view, go to the Background Maps settings and select None.
4. Adjust Chart Types for Each Layer
To create the hierarchy:
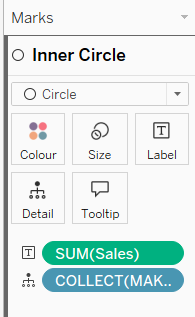
- Set the first layer to display Inner Circle.
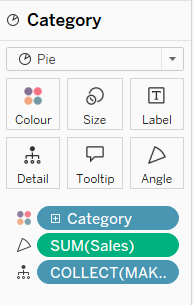
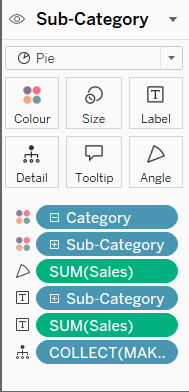
- Set the second layer to display Sales by Category.
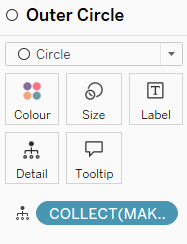
- Set the third layer to display Outer Circle.
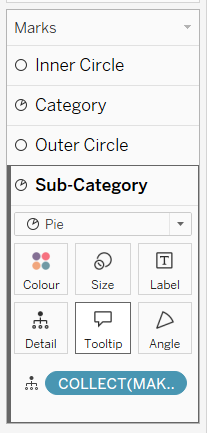
- Set the fourth layer to display Sales by Sub-Category.
Each layer builds on the hierarchy, creating the rings of the sunburst.
5. Resize for Proportions
To configure the proper proportions for each layer:
- Adjust the size of each layer as needed to maintain the hierarchy’s balance.
- Use shortcuts for overall size adjustments:
- Ctrl + Shift + B to make the chart larger.
- Ctrl + B to make it smaller.
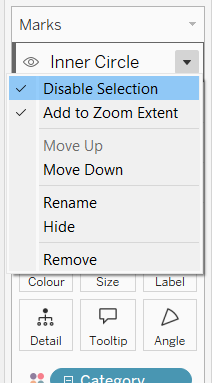
6. Disable Selection for Circles
For a polished and intuitive experience, disable the selection functionality for the inner and outer circles.
7. (Optional) Add More Layers
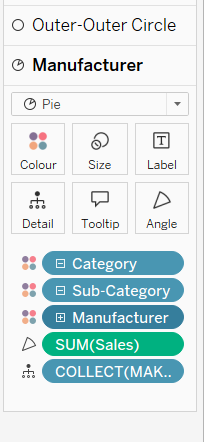
You can expand the hierarchy by adding another layer. For example:
- Add Manufacturer to show sales across each manufacturer, and its relationship to the Sub-Category and Category layers.
Important Considerations
While sunburst charts are visually appealing, it’s essential to consider their practical application:
- The goal of any visualisation is to effectively communicate insights.
- Often, simpler charts (such as bar or line charts) are more effective at conveying information clearly and quickly.
Sunburst charts should be reserved for instances where understanding hierarchical relationships is critical.