Descriptive statistics provide essential tools to summarise and describe the main features of data. When dealing with data, it is crucial to understand key concepts like mean, median, and mode. Another important aspect is knowing when to use an average versus a weighted average. In this post, I'll walk through these foundational concepts and their applications in making sense of data.
Mean: The Common Average
The mean is one of the most frequently used metrics in statistics. It’s calculated by adding up all values in a dataset and dividing by the number of values. It can be used with both discrete and continuous data. The mean gives us a single value that summarises the entire dataset. However, be aware of that it can be sensitive to extreme values, or outliers, which can skew the average and may not always represent the “typical” value of the data well.
Formula
Example
Imagine you’re analysing an order data set: 2, 30, 35, 42, 50
Mean value is (2 + 30 + 35 + 42 + 50) / 5 = 31.8
Median: The Middle Value
The median represents the middle value in an ordered dataset. If there’s an odd number of values, the median is the middle one; if there’s an even number of values, the median is the average of the two middle values. Note that the median is less affected by outliers and skewed data. Therefore, it is often a more representative measure for skewed data.
Example
For the data set 2, 30, 35, 42, and 50, the median is 35 because it's the middle value.
2, 30, 35, 42, 50
Note that for a dataset 2, 30, 35, 42, 50, and 55, the two middle values here are 35 and 42. The median would then be calculated as:
(35 + 42) / 2 = 38.5
Mode: The Most Frequent Value
The mode is the value that appears most frequently in a dataset. It’s especially useful for categorical data where we want to identify the most common category or preference. However, note that the mode can only be used when dealing with small amounts of data.
Example
Consider the dataset 5, 11, 5, 16, 20, 5, and 60. The mode here is 5, as it appears three times, while all other numbers appear only once.
Difference Between Average and Weighted Average
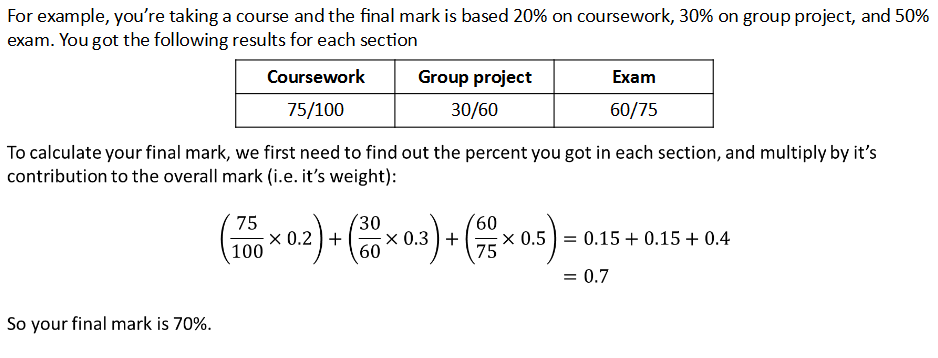
Average typically refers to the mean of a dataset. But in some cases, not all data points have equal importance. That’s when we use a weighted average, which assigns different weights to different values based on their significance or frequency. The average (simple mean) treats all data points equally, whereas a weighted average is calculated by assigning weights to each value, then dividing the sum of these weighted values by the total weights.
Example
During our Stats 101 session today, we worked with a following example:

Another good example is a superstore which sold 3 items (apples, pears and oranges) and orders its supplies from two stockists:
Stockist | Item | Cost per item | Quantity |
A | Apples | £0.50 | 10 |
A | Pears | £0.30 | 12 |
A | Oranges | £0.40 | 15 |
B | Apples | £0.70 | 6 |
B | Pears | £0.50 | 4 |
B | Oranges | £0.60 | 3 |
The average (simple mean) cost per item is:

The weighted average cost per item is taking into account the quantity:

When to Use Each Measure
- Mean: Use when the data is symmetric and lacks outliers, as it provides a straightforward average.
- Median: Use for skewed distributions or data with outliers; it’s more representative of central tendency in these cases.
- Mode: Use for categorical or nominal data to determine the most common category.
- Weighted Average: Use when data points have varying levels of importance or relevance.
