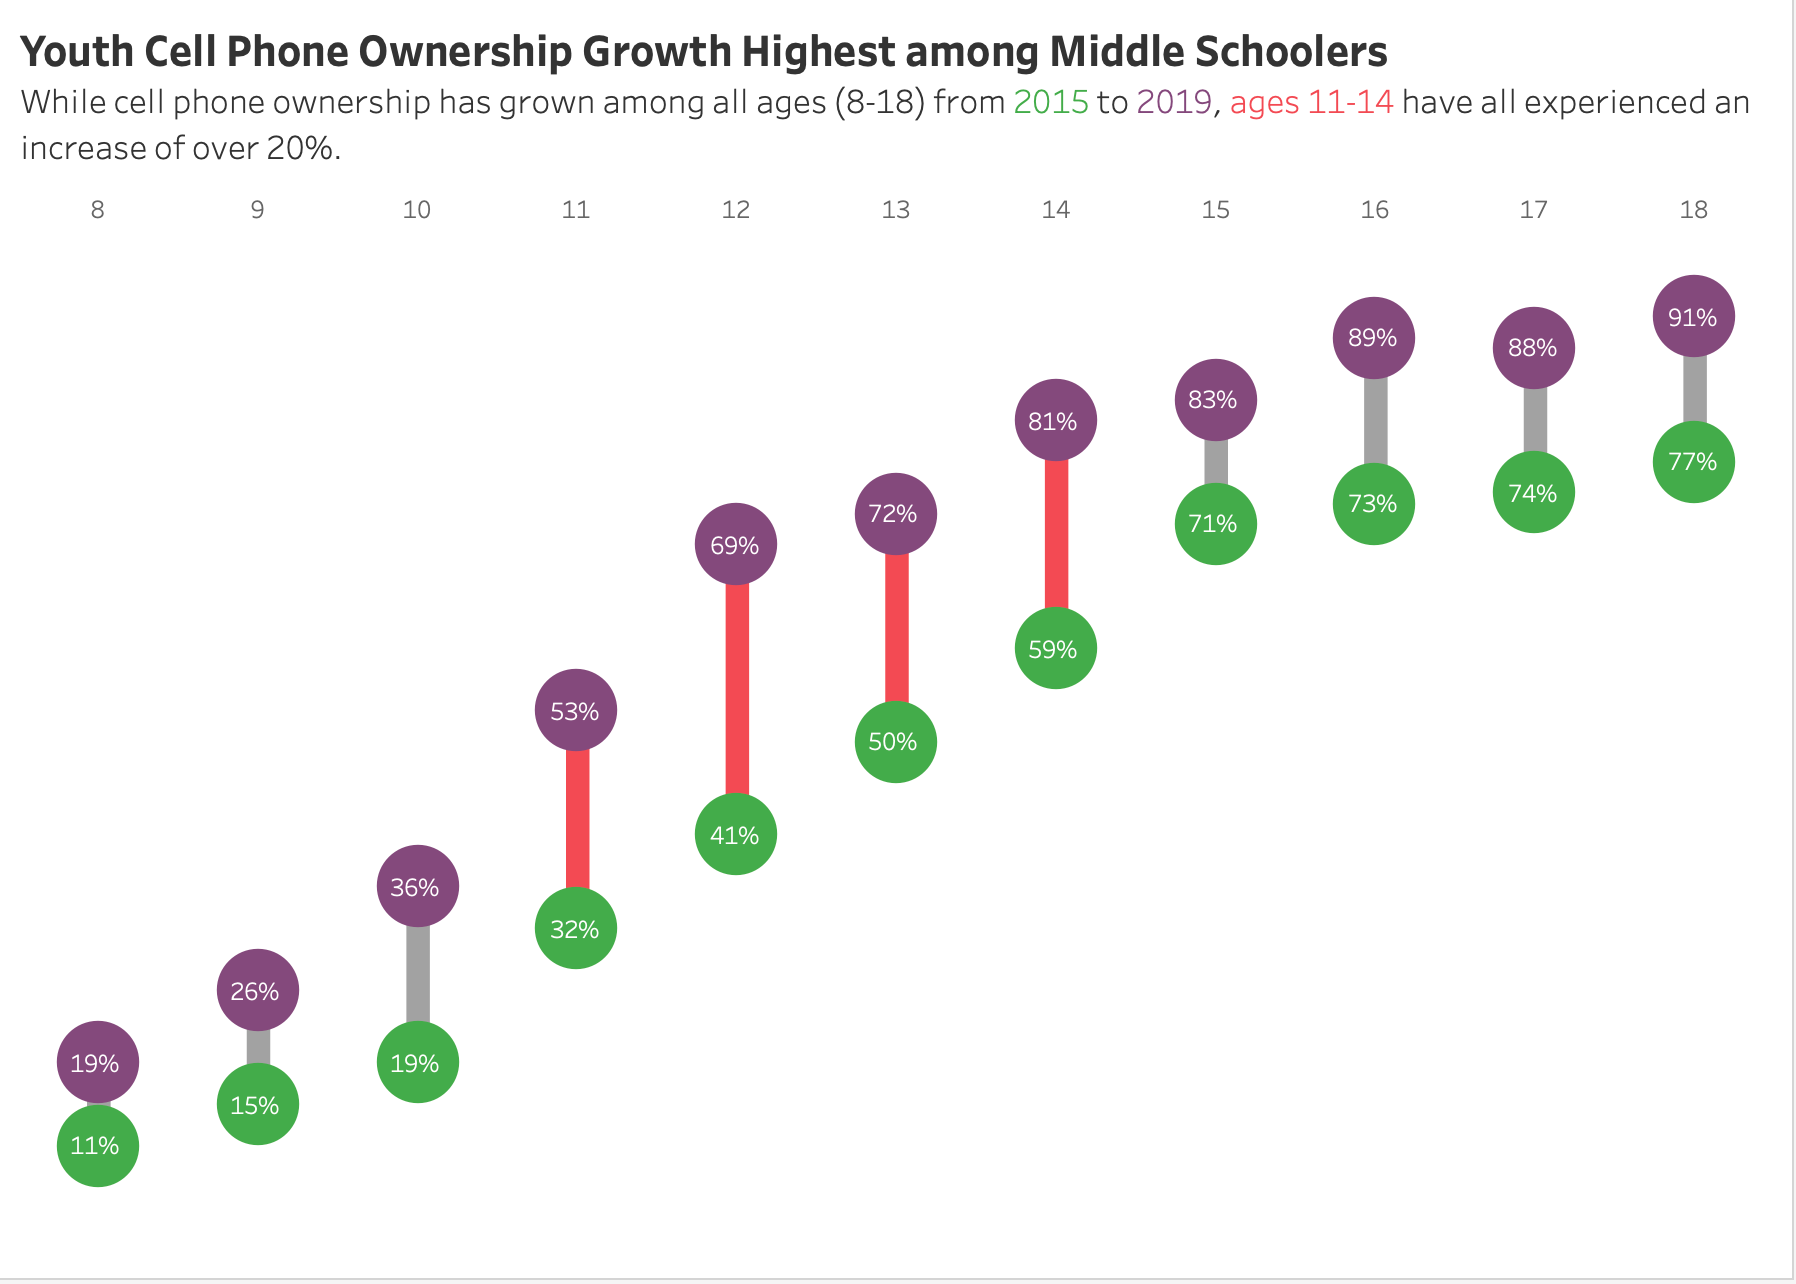
Ever wondered how to build a dumbbell chart? Dumbbell charts effectively highlight differences between two data points across multiple categories, making it easier to visualise changes and compare values in a clear, concise format. On top of that they are super simple to build. So let me walk you through how to build a dumbbell chart like the one above!
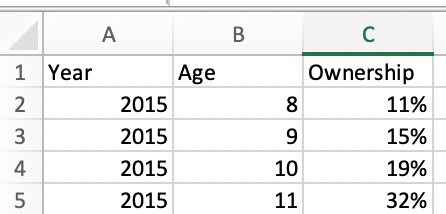
I am using a data set from #WOW2022 Week 32 (link: https://workout-wednesday.com/2022w32tab/). This data set contains data on cell phone ownership among different age groups (8-18) in the years 2015 and 2019. Here's a quick snapshot of the data:
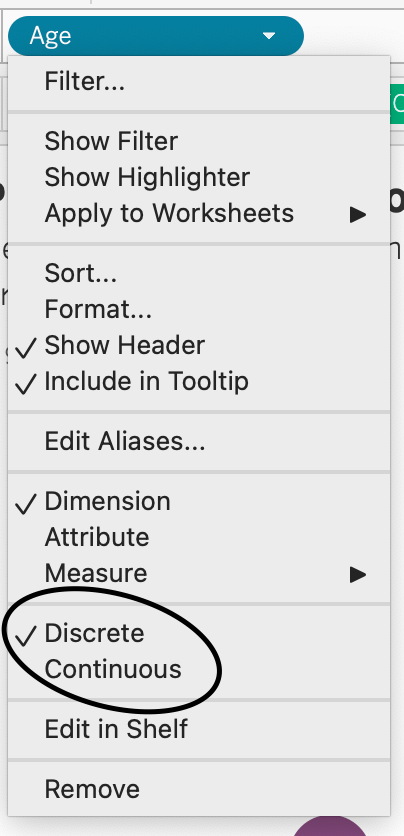
Firstly, drag Age to the columns shelf and change the data type from continuous (green) to discrete (blue) - green aggregates and creates an axis while blue divides and creates headers.
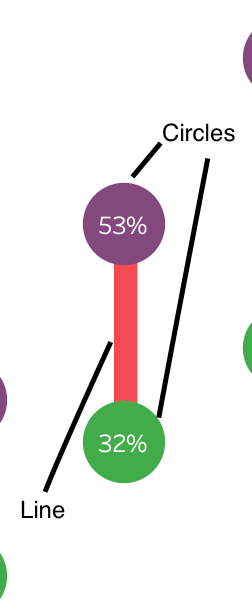
Afterwards, bring our measure, in this case, Ownership into the rows shelf - twice - to use one measure for the circles and the other one for the lines connecting them.
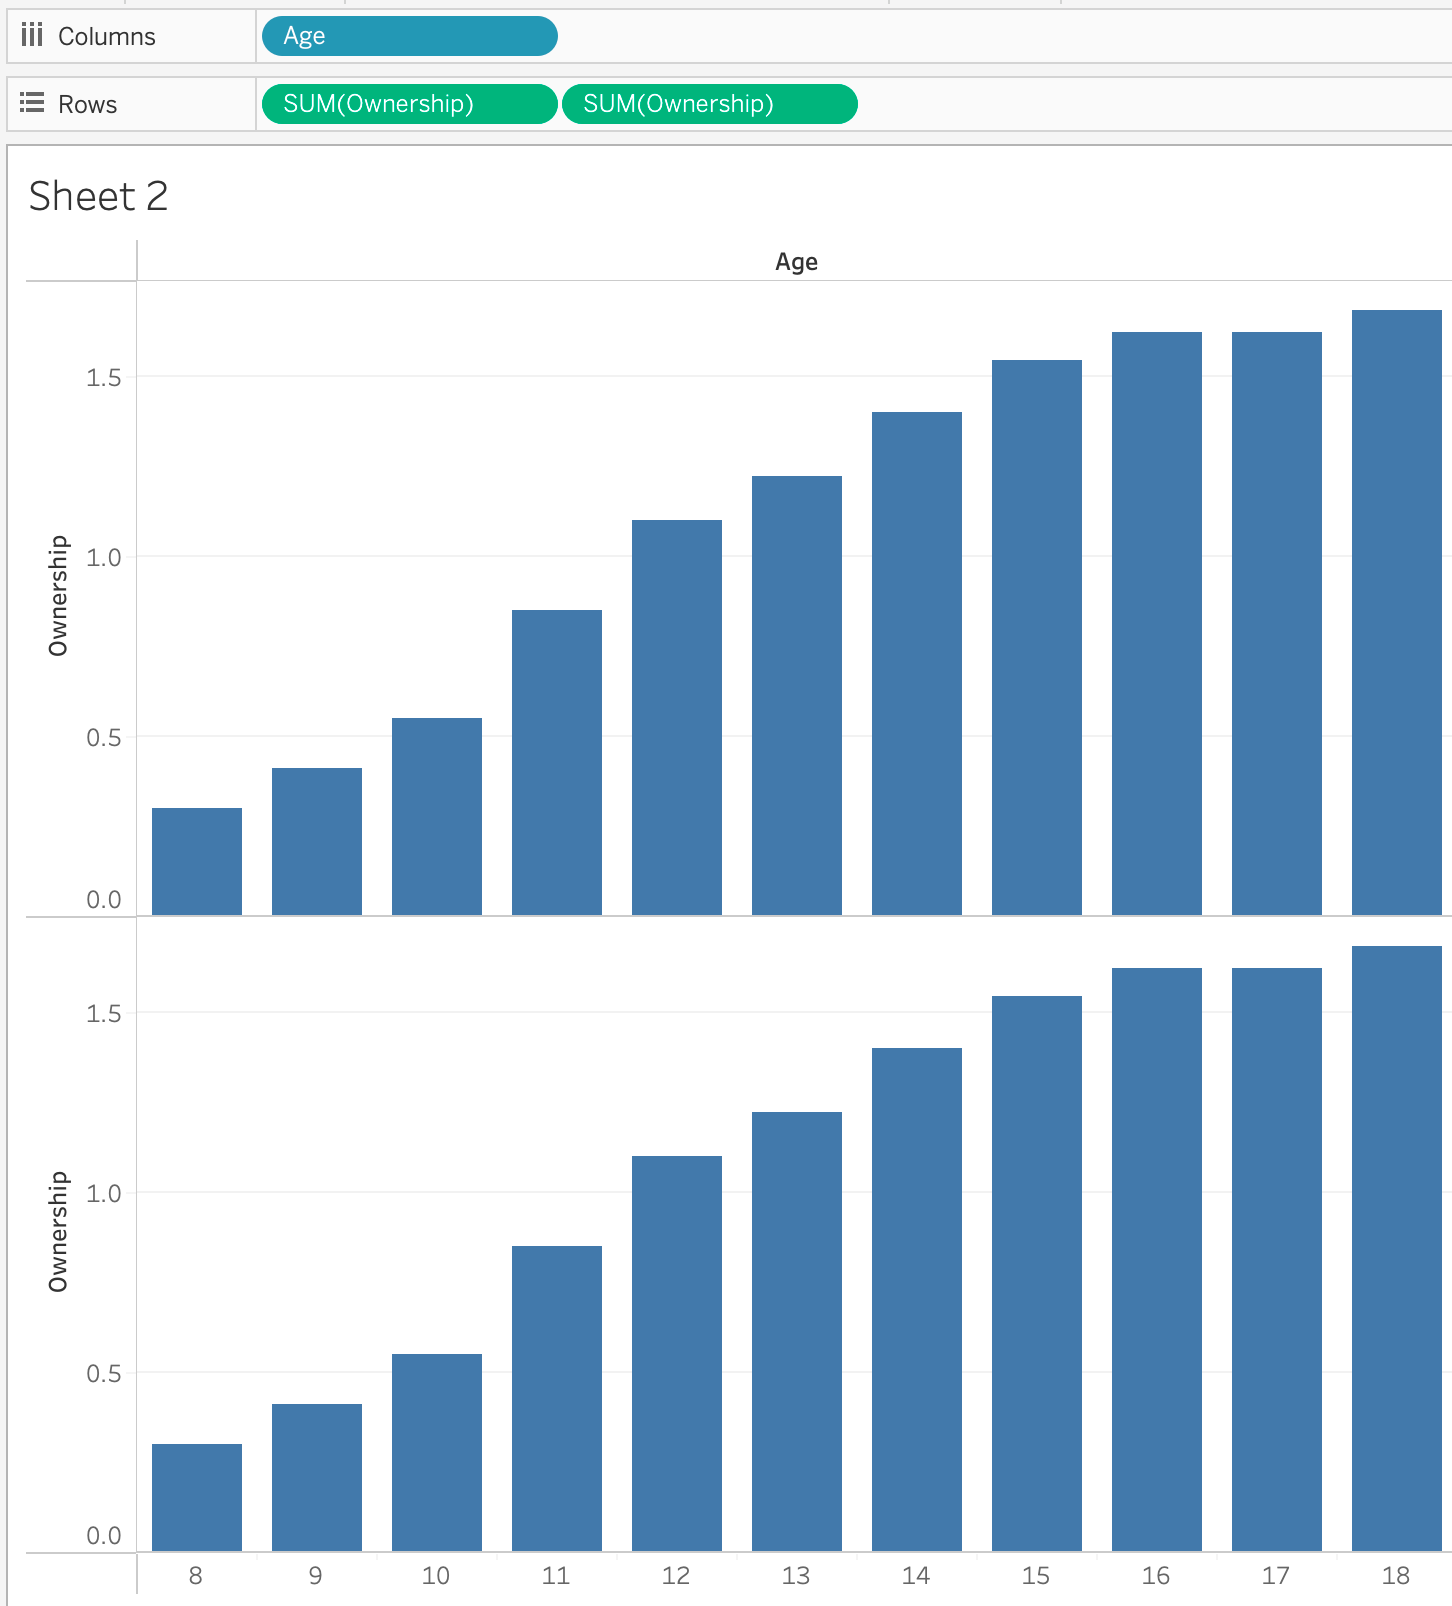
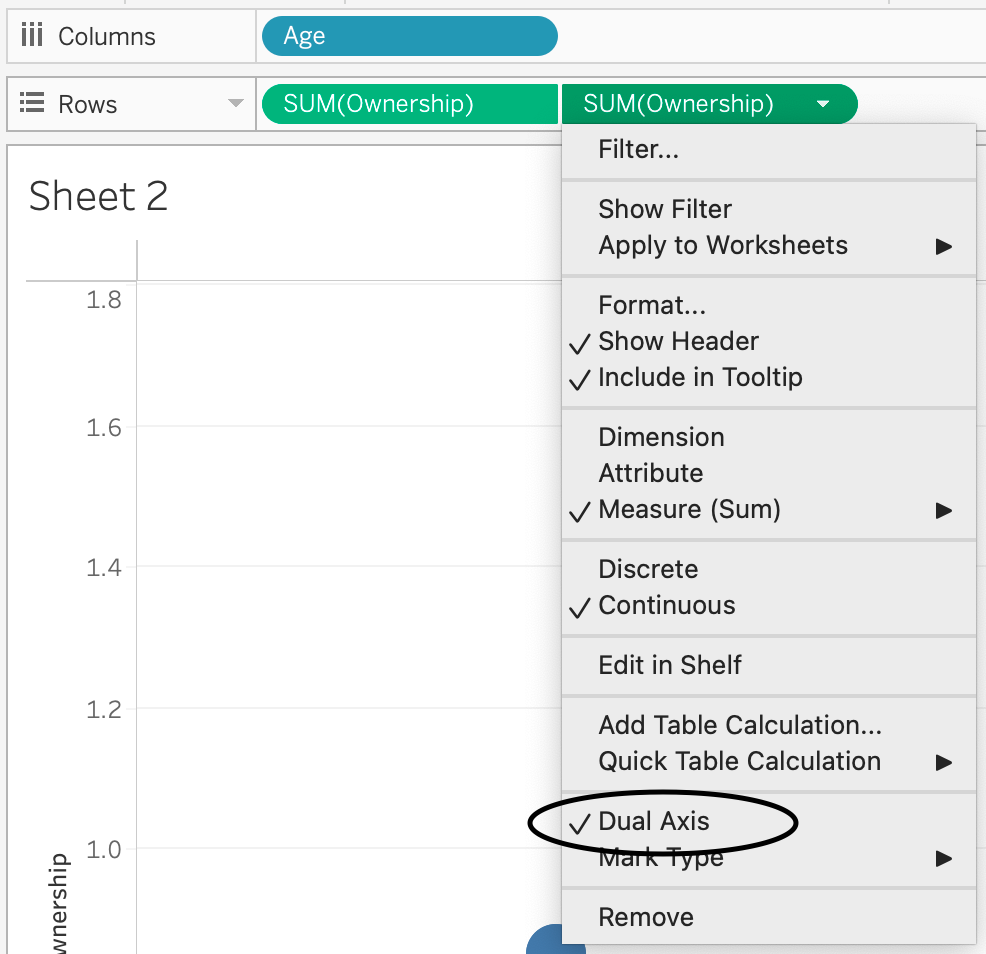
Then, click on Dual Axis and synchronise the axes.
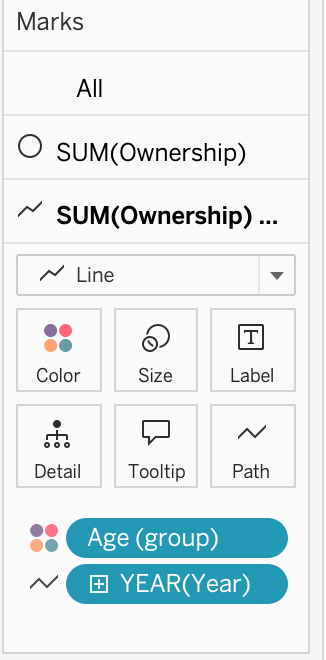
On the first Ownership field on the Marks card change the mark type to circle. Drag Year to a colour shelf and Ownership to a label.
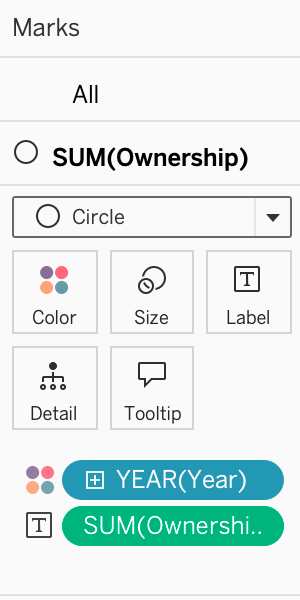
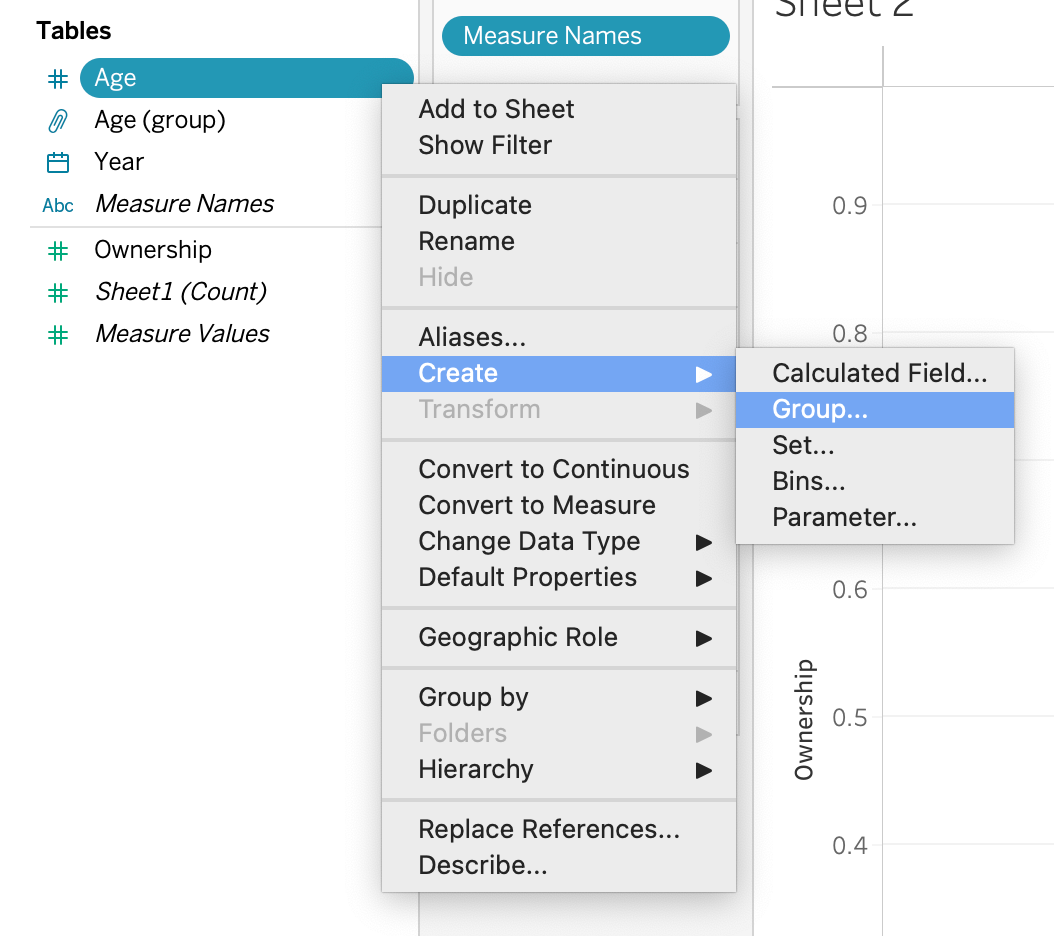
On the second Ownership field on the Marks card change the mark type to line and drag Year to path shelf. Then, choose Age and create a group - one for age with an increase in Ownership of over 20% and the second for the rest.
Drag the Age (group) to the colour shelf on the second Ownership field.
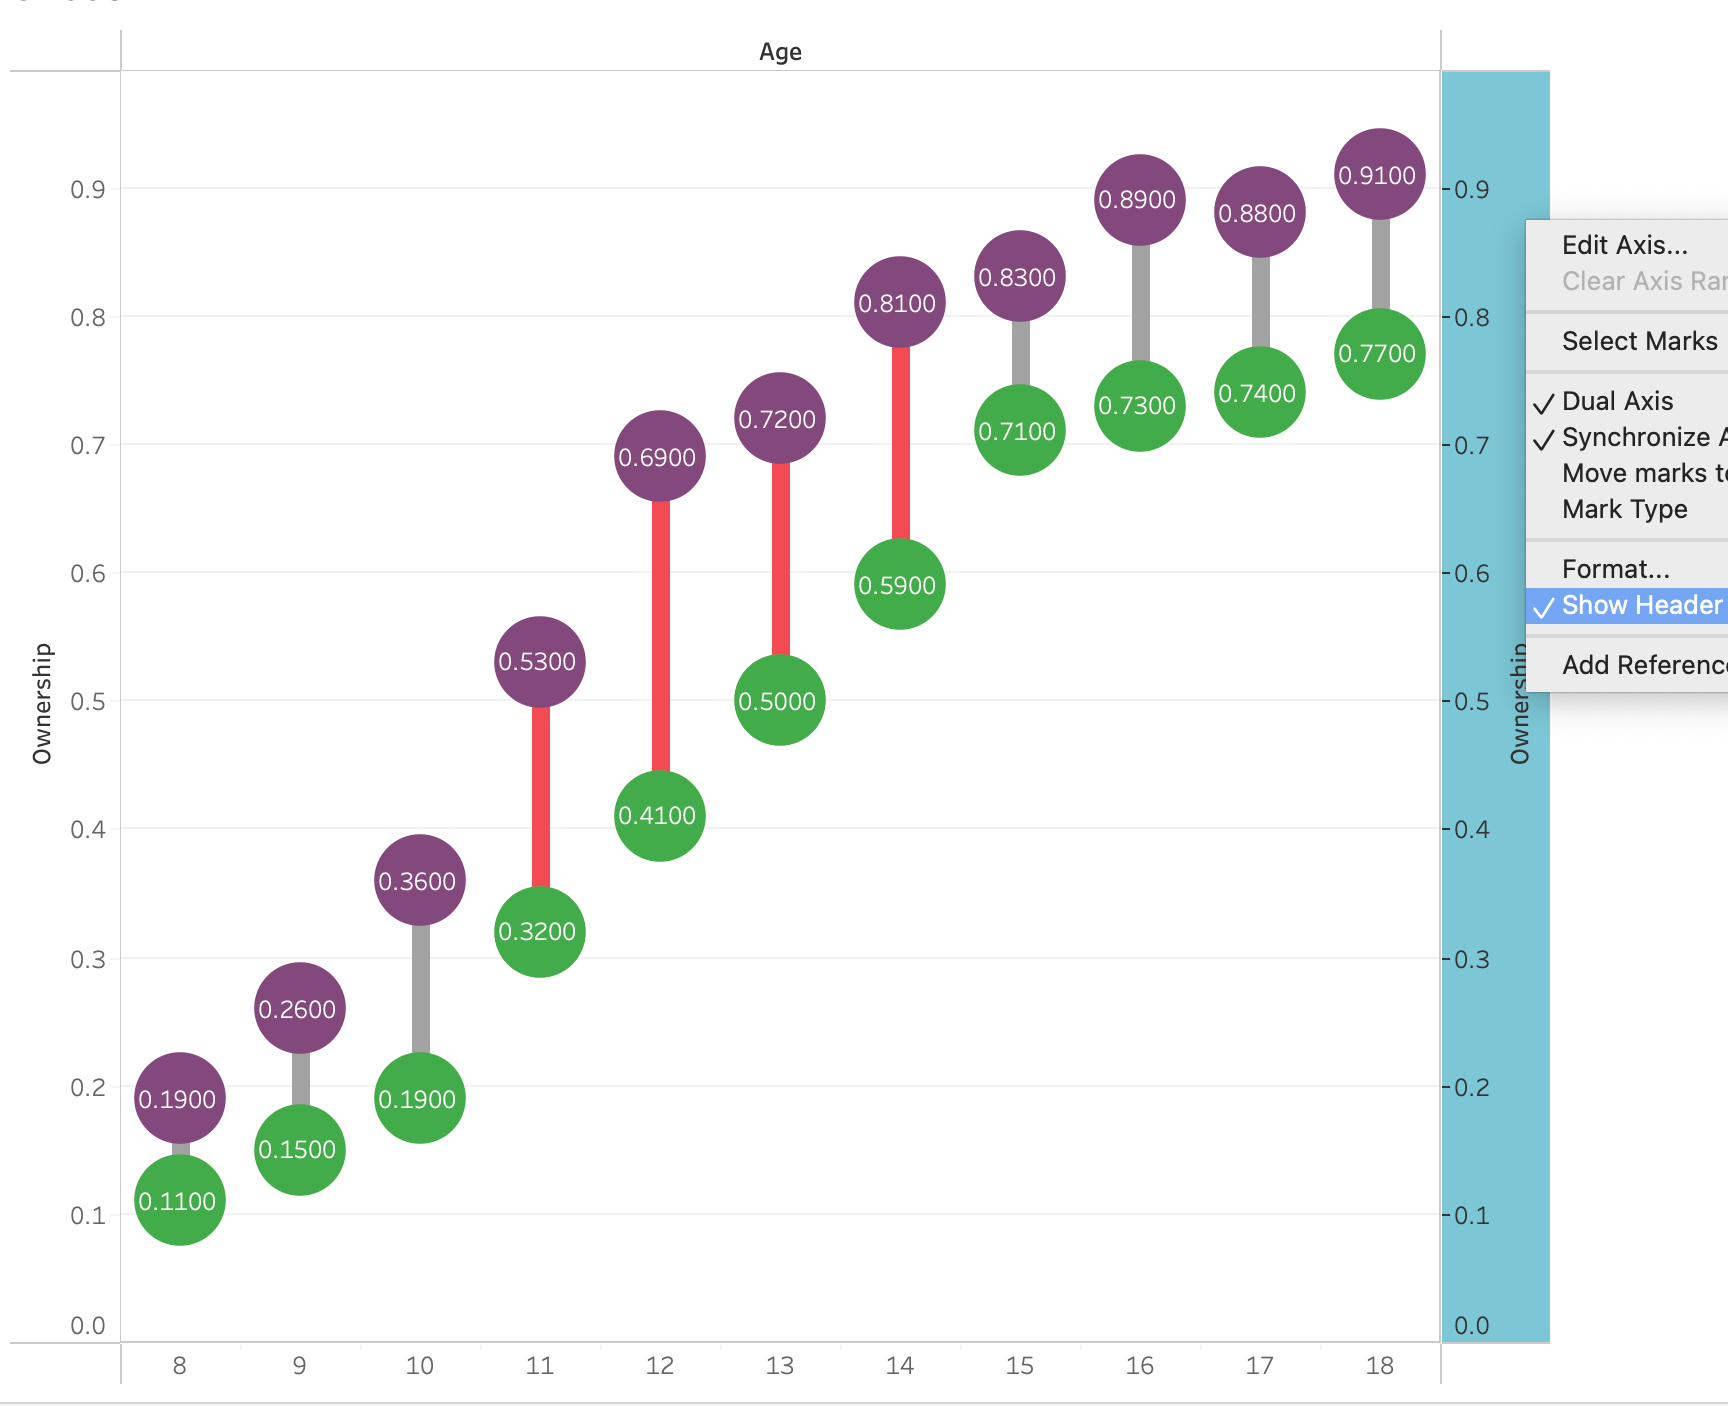
Lastly, untick the show header option on both Ownership axes, hide the age label and remove row borders in the format.
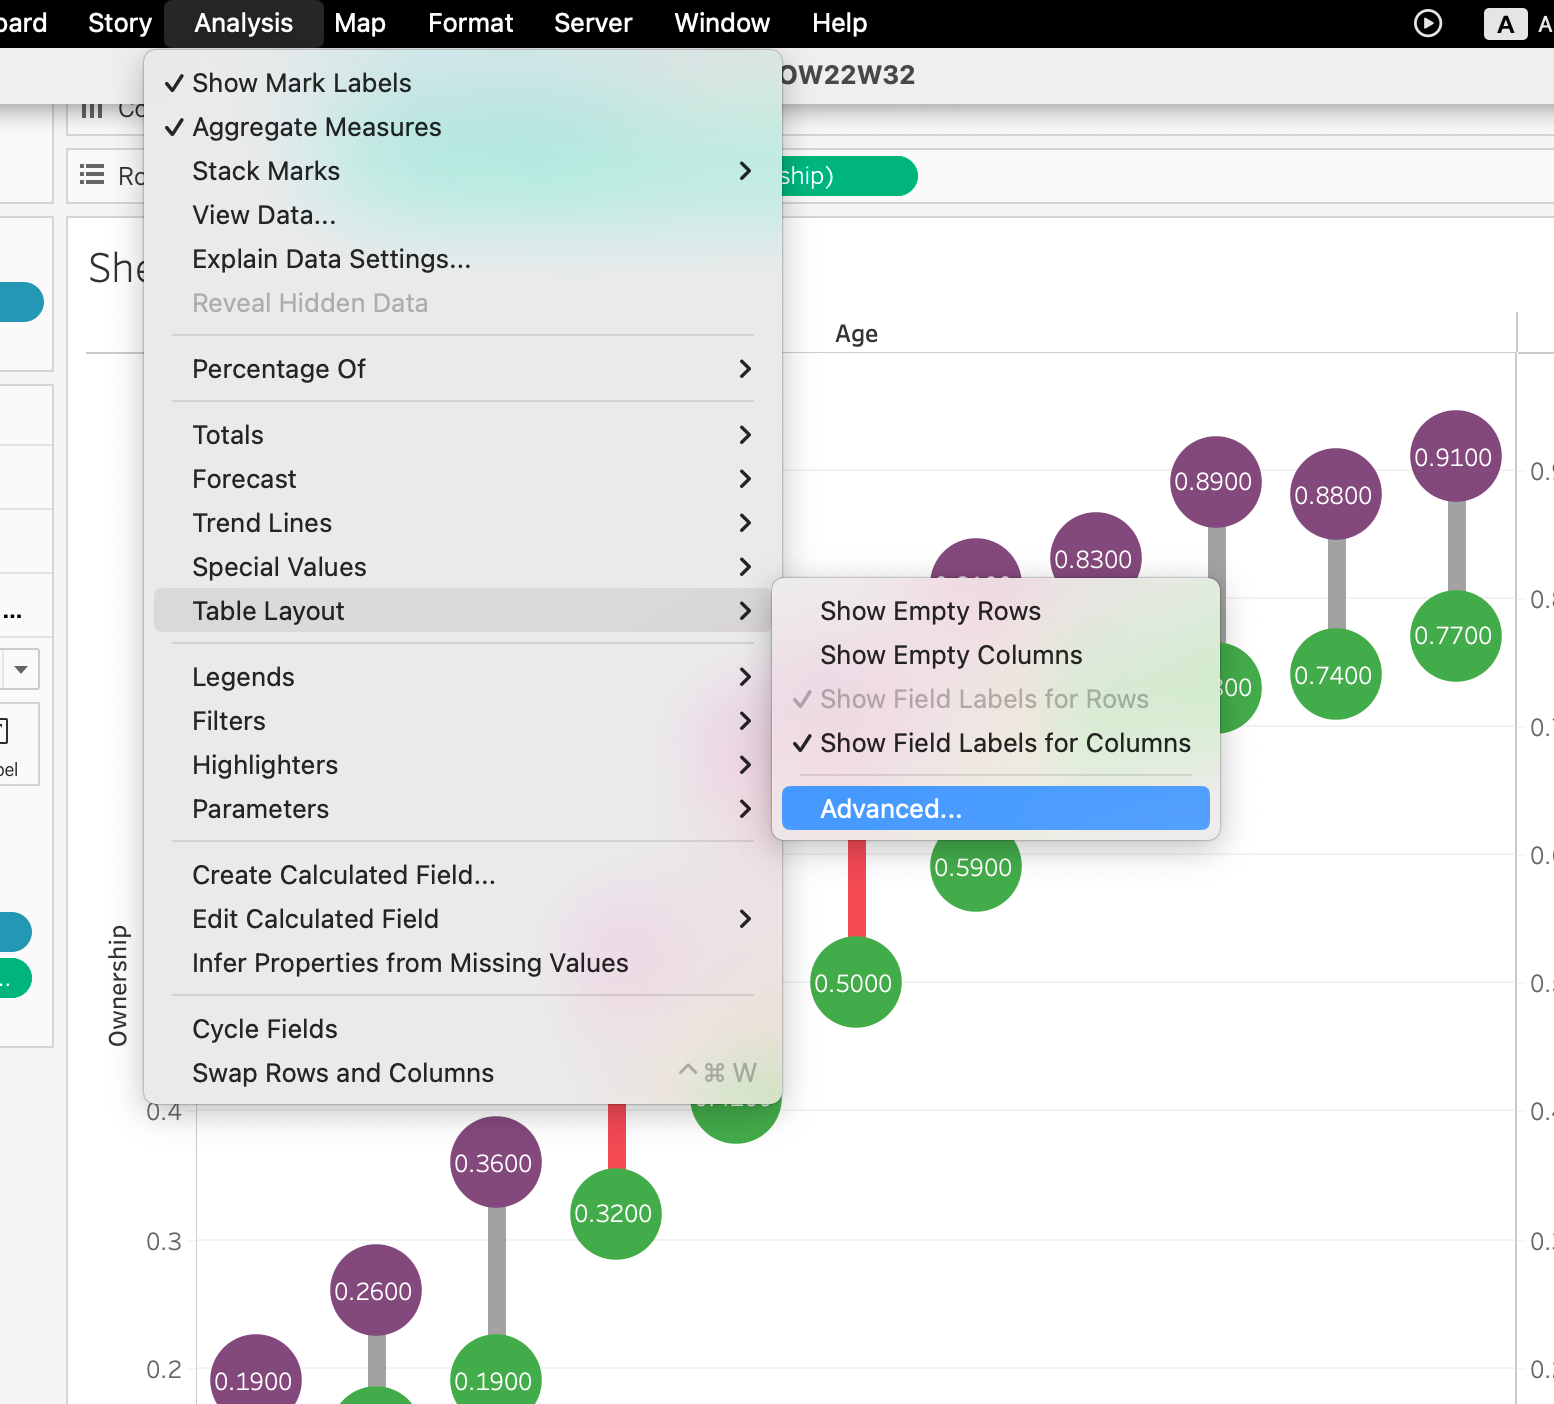
To move the X (Age) axis to the top, click on the Analysis pane -> Table Layout -> Advanced
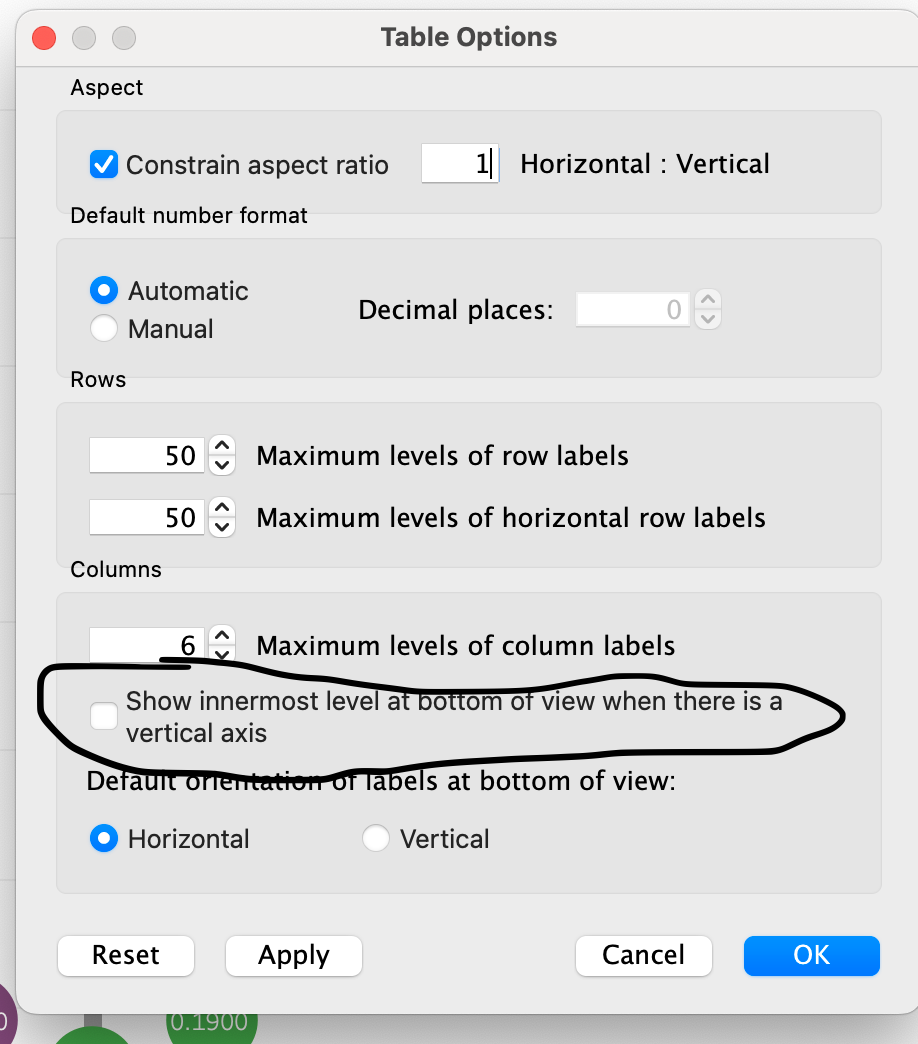
Untick the "Show innermost level at the bottom view when there is a vertical axis".
And that's it!